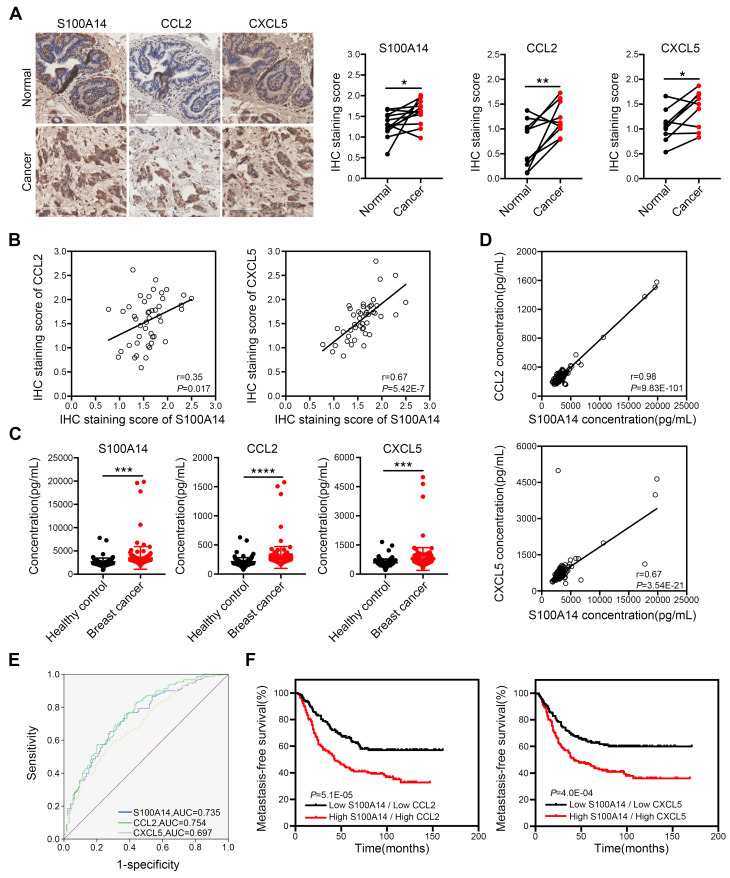
Figure 6.
Clinical significance of S100A14, CCL2 and CXCL5 in breast cancer. (A) The expression of S100A14, CCL2 and CXCL5 was analyzed in breast cancer tissues and their adjacent normal tissues by IHC. Representative images (left) and statistical analyses (right) showing by IHC staining that S100A14, CCL2 and CXCL5 are overexpressed in breast cancer tissues. Scale bars=100 μm. (B) Pearson's correlation analysis showing that S100A14 expression significantly correlates with CCL2 and CXCL5 expression. (C) Serum levels of S100A14, CCL2 and CXCL5 in breast cancer patients and healthy controls were detected by ELISA. The statistical analysis of S100A14, CCL2 and CXCL5 serum levels in breast cancer patients and healthy controls is shown. (D) Pearson's correlation analysis showing that the S100A14 level significantly correlates with the CCL2 and CXCL5 in serum levels. (E) The ROC curve of S100A14, CCL2 and CXCL5 serum levels of breast cancer patients and healthy controls was analyzed to calculate the optimal sensitivity and specificity for the detection of breast cancer. (F) Kaplan-Meier analysis for metastasis-free survival of breast cancer patients in the GEO database (GSE2034, GSE2603, GSE5327 and GSE12276). Patients were divided into two groups based on the combined analysis according to the median value for S100A14 and CCL2/CXCL5. The log-rank test P values are shown. Data in A is statistically analyzed with paired t-test; and C are presented with the mean ± SD and analyzed by 2-sided t-test; * P<0.05, ** P<0.01, *** P<0.001, **** P<0.0001.

