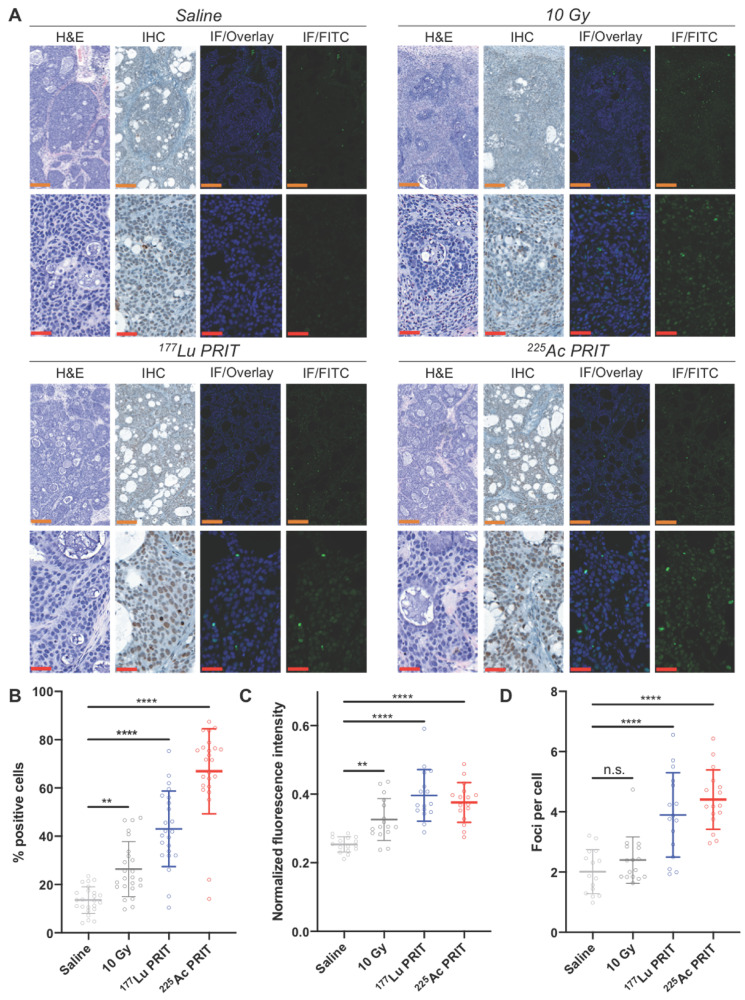
Figure 4.
Ex vivo γH2AX immunostaining for the monitoring of α-/β-PRIT in tumor sections of PDAC mouse model 72 hours post-irradiation (n=3 per cohort). A. Representative microscopy images (orange scale = 200 μm, red scale = 50 μm). Zoomed-in area are provided in Supporting information (Figure S8) B. Percentage of γH2AX positive cells after immunohistochemistry analysis of tumor sections following α-/β-PRIT as compared to negative and positive controls (n=8 per slide). Quantification of: C. γH2AX fluorescent signal normalized to DAPI signal (n=8 per slide), and D. γH2AX foci per cell (n=6 per slide), after immunofluorescence analysis of tumor sections following α-/β-PRIT as compared to negative and positive controls. Values are represented as means, and error bars represent standard deviations. One-Way ANOVA followed by a Dunnett's multiple comparisons test was applied. Adjusted P values: **** P≤ 0.0001, ** P≤ 0.01, n.s. = non significant.

