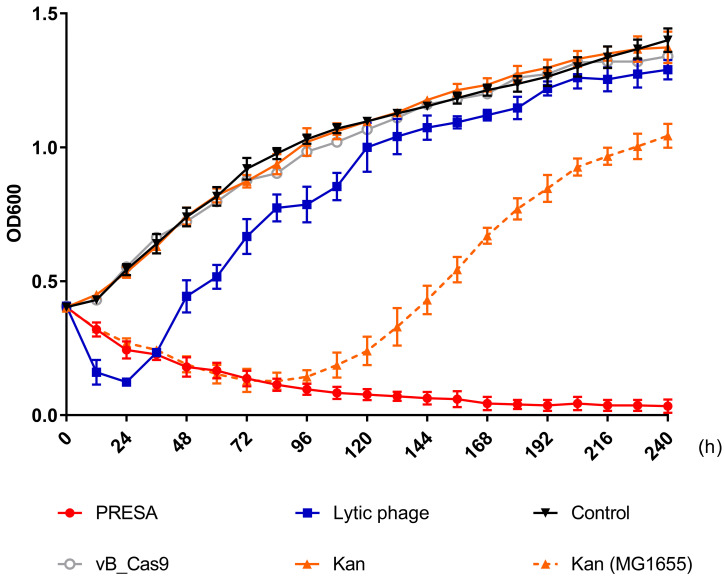
Figure 3.
Solid curves represent the growth of the MG1655 pUCtargetk strain treated with PRESA, lytic phage vB_253, kanamycin, vB_Cas9 and the PBS control. Phages added in each group were at a MOI of 10. The dashed curve represents the growth of MG1655 strain treated with kanamycin. Each dot represents the OD600 value (n = 3, mean ± SD) at the indicated time point relative to 0 h.

