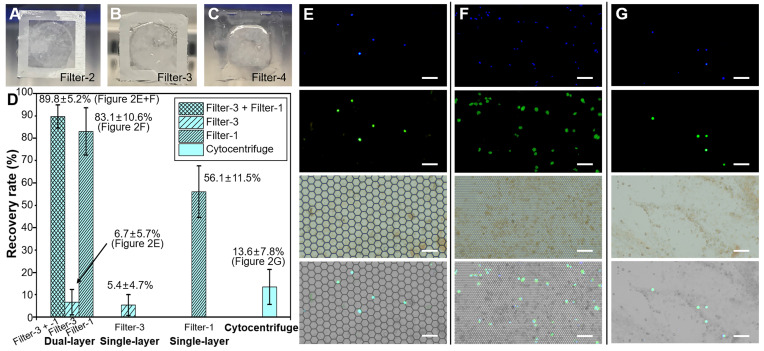
Figure 2.
(A-C) The photos of PERFECT filter-2, -3 and -4 after filtration of BALF. (D) The recovery rates of 10000 pre-labeled A549 cells spiked in 10 mL BALF with the dual-layer (Filter-3 and Filter-1, sequentially), single-layer (Filter-3 only), single-layer (Filter-1 only) and cytocentrifuge, respectively. (E-F) The images of separated A549 cells on the Filter-3 and Filter-1 through the dual-layer filtration. (G) The images of separated A549 cells on the glass slide after centrifugation. Scale bars represent 100 μm in E-G.

