Figure 6.
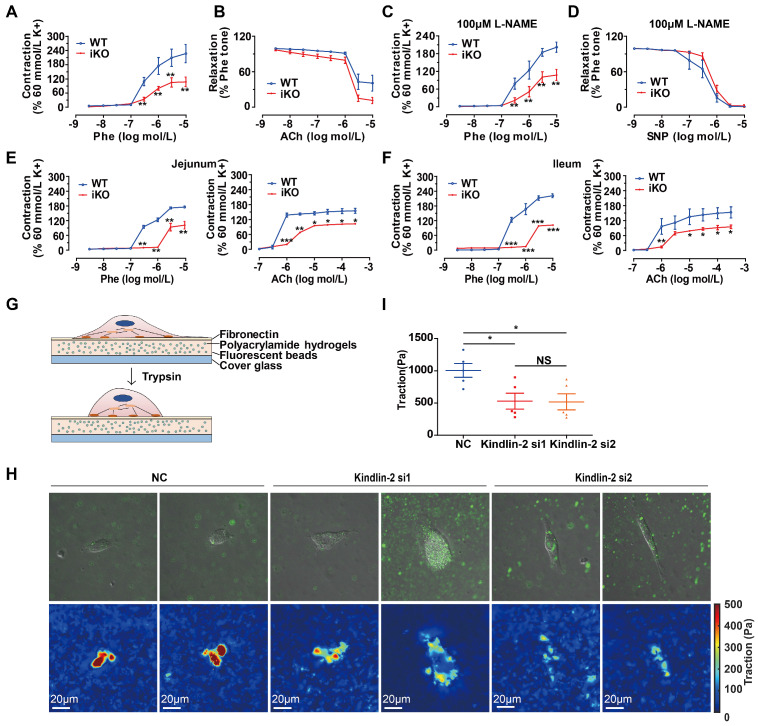
Loss of Kindlin-2 damaged the contractile function of adult smooth muscle. (A) Cumulative concentration-response curves (from 3nM to 10 μM) for the phenylephrine- (Phe-) induced contraction of aortic rings from WT and KO mice. Mice were treated with tamoxifen injection at 8 weeks and rested for 2 weeks before the experiment. Data were presented as the mean ± SEM (n=6). **p < 0.01 by student's t-test. (B) Cumulative concentration-response curves (from 3nM to 10 μM) for the acetylcholine-(ACh-) induced relaxation of aortic rings from WT and iKO mice. Data were presented as the mean ± SEM (n=6). (C) Cumulative concentration-response curves (from 3nM to 10 μM) for the Phe-induced contraction of aortic rings from WT and iKO mice. Rings were incubated with 100μM L-NAME before Phe-induced contraction. Data were presented as the mean ± SEM (n=6). **p < 0.01 by student's t-test. (D) Cumulative concentration-response curves (from 3nM to 10 μM) for the SNP-induced relaxation of aortic rings from WT and iKO mice. Rings were incubated with 100μM L-NAME before Phe-induced contraction. Data were presented as the mean ± SEM (n=6). (E) Cumulative concentration-response curves (Phe: from 3nM to 10 Μm, Ach: from 100nM to 300 μM) for the Phe- and ACh -induced contraction of jejunum from WT and iKO mice. Data were presented as the mean ± SEM (n=4). *p < 0.05, **p < 0.01 and ***p < 0.001 by student's t-test. (F) Cumulative concentration-response curves (Phe: from 3nM to 10 Μm, Ach: from 100nM to 300 μM) for the Phe- and ACh -induced contraction of ileum from WT and iKO mice. Data were presented as the mean ± SEM (n=4). *p < 0.05, **p < 0.01 and ***p < 0.001 by student's t-test. (G) Schematic illustration of a cell traction force microscopy (CTFM) experiment depicts elastic substrate deformed by an adherent cell. The cell is detached with trypsin to monitor displacement field. (H) Traction forces of PVSMC using CTFM. The traction force map is color coded, with red representing the highest force and blue representing the lowest. (I) Quantitation of the highest traction force in (H). Data were presented as the mean ± SEM (n=5). *p < 0.05 by student's t-test.

