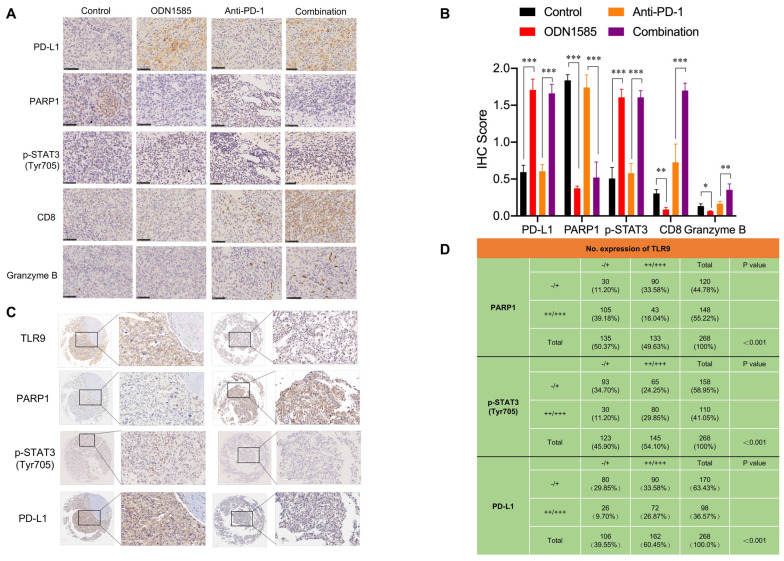
Figure 5.
Correlations among the expression of TLR9, PARP1, p-STAT3 (Tyr705) and PD-L1 in mouse and human tumor tissue samples. (A) Immunohistochemical staining for PD-L1, PARP1, p-STAT3, CD8, and granzyme B protein expression patterns in Hepa1-6 tumors. Scale bar, 50 μm. (B) Histogram showing the immunohistochemistry score of PD-L1, PARP1, p-STAT3, CD8 and Granzyme B in each group. (values are mean ± SD, *p < 0.05, **p < 0.01, ***p<0.001). (C) Representative images of immunohistochemical staining of HCC tumors for TLR9, PARP1, p-STAT3 (Tyr705) and PD-L1. Patient tissue samples were stained for TLR9, PARP1, p-STAT3 and PD-L1. (D) Correlations between TLR9 levels and PARP1, p-STAT3 (Tyr705) or PD-L1 levels in liver cancer patients. p, Pearson chi-square test; -/+, negative or low expression; ++/+++, medium or high expression. Scale bar, 100 μm.

