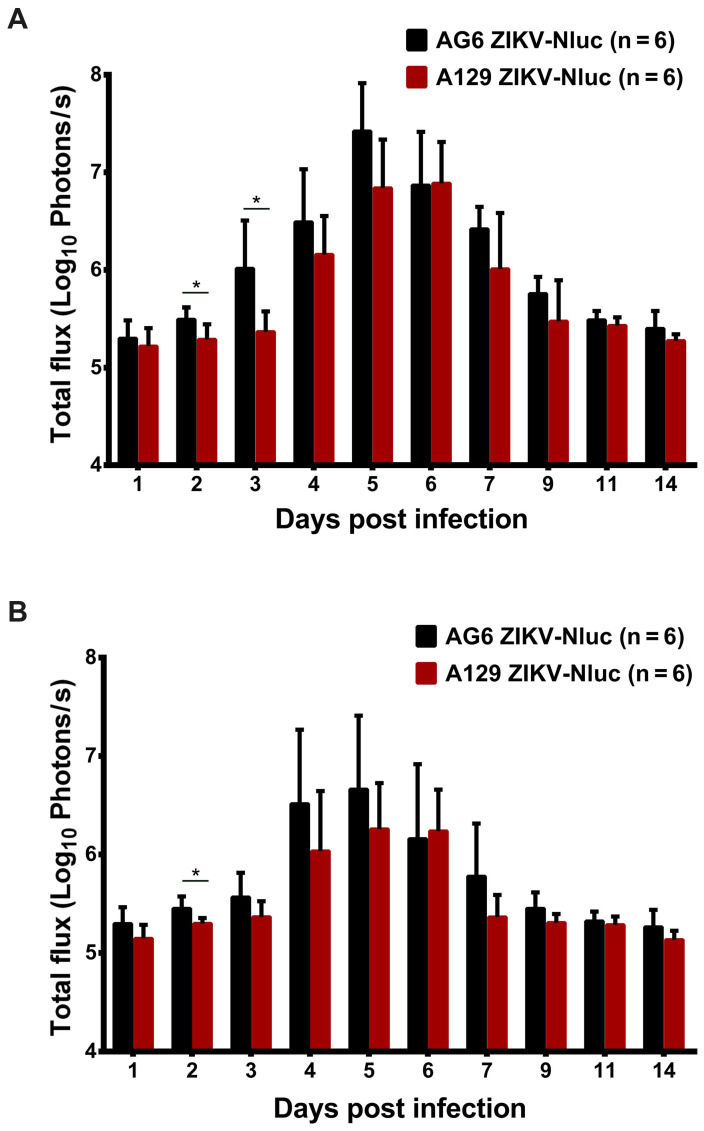
Figure 7.
Comparison of total fluxes from AG6 and A129 mice infected with ZIKV-Nluc. (A) The average radiance of AG6 and A129 mice infected with ZIKV-Nluc (mice in Figure 5) was determined by the ROI analysis of the ventral side. (B) The average radiance of AG6 and A129 mice infected with ZIKV-Nluc (mice in Figure 6) was determined by the ROI analysis of the dorsal side. Data represent the mean ± SD analysed by Student's t-test (two tailed) (*, P < 0.05; **, P < 0.01; ***, P < 0.001).

