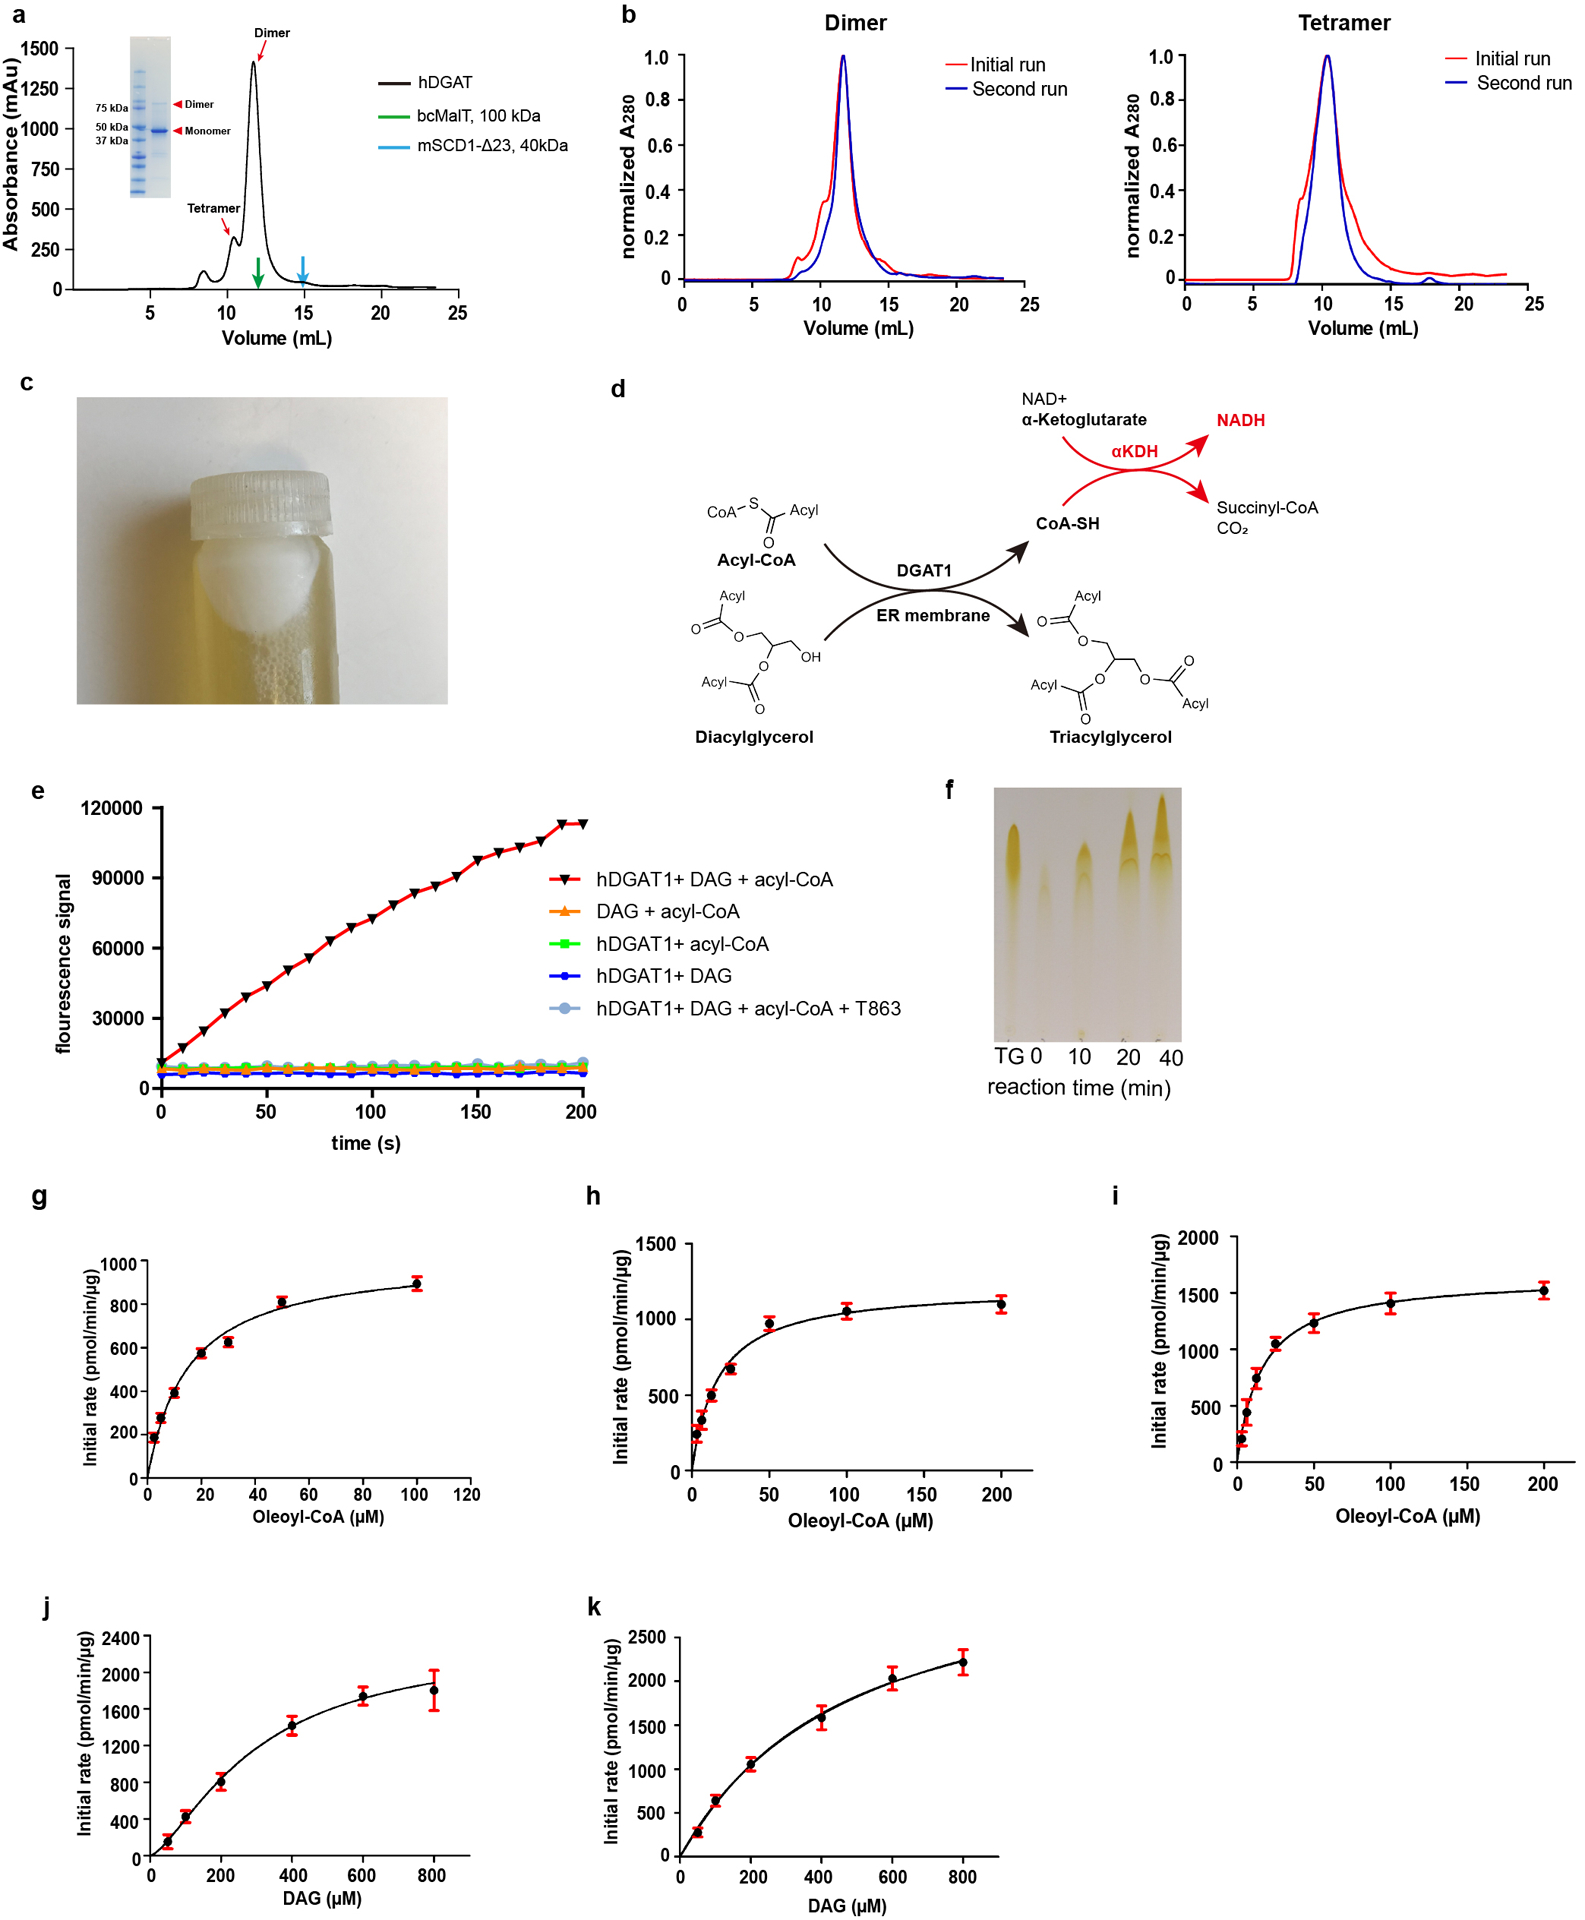
Extended Data Figure 2. Purification and functional characterization of hDGAT1.

a. Size exclusion profile of hDGAT1 extracted with LMNG. Elution volumes of membrane proteins of known molecular weight, bcMalT (100 kDa, green)39 and mouse SCD1 (41 kDa, blue)22 are marked by arrows. Inset: SDS-PAGE of the purified hDGAT1. hDGAT1 has a main peak with an elution volume of ~11.7 ml which corresponds to a dimer and a minor peak at ~10.4 ml which corresponds to a tetramer. b. Size-exclusion profiles of hDGAT1 extracted with LMNG (left) or GDN (right). In both a and b, the detergent in the mobile phase is GDN. c. A white layer of fat appeared after membrane solubilization and centrifugation, indicating that the heterologously expressed hDGAT1 is active in cells. d. hDGAT1 reaction is coupled to that of α-ketoglutarate dehydrogenase (αKDH) to monitor production of Coenzyme A in real time. e. Fluorescence of NADH plotted versus time. Rapid production of Coenzyme A occurs in the presence of oleoyl-CoA, 1,2-dioleoyl-sn-glycerol (1,2-DAG) and the purified dimeric hDGAT1. In contrast, Coenzyme A production was not observed when either 1,2-DAG or hDGAT1 was omitted from the reaction mixtures indicating that hydrolysis of oleoyl CoA is tightly coupled to the enzymatic reaction. In addition, coenzyme A production was almost completely suppressed in the presence of 5 μM T863, a known hDGAT1 inhibitor40. f. Production of TG over time detected by thin layer chromatography. The first lane from the left is a TG standard. g-i. Initial rate of reaction versus oleoyl-CoA concentrations measured using the purified dimeric hDGAT1 (g), tetrameric hDGAT1 (h) or hDGAT1 in cell membrane (i). j-k. Initial rate of reaction versus DAG concentrations measured using the dimeric (j) or tetrameric (k) hDGAT1. Error bars are s.e.m. derived from three independent repeats. Experiments in a and c were repeated independently 10 times with similar results. Experiments in b, e and f were repeated independently 3 times with similar results.
