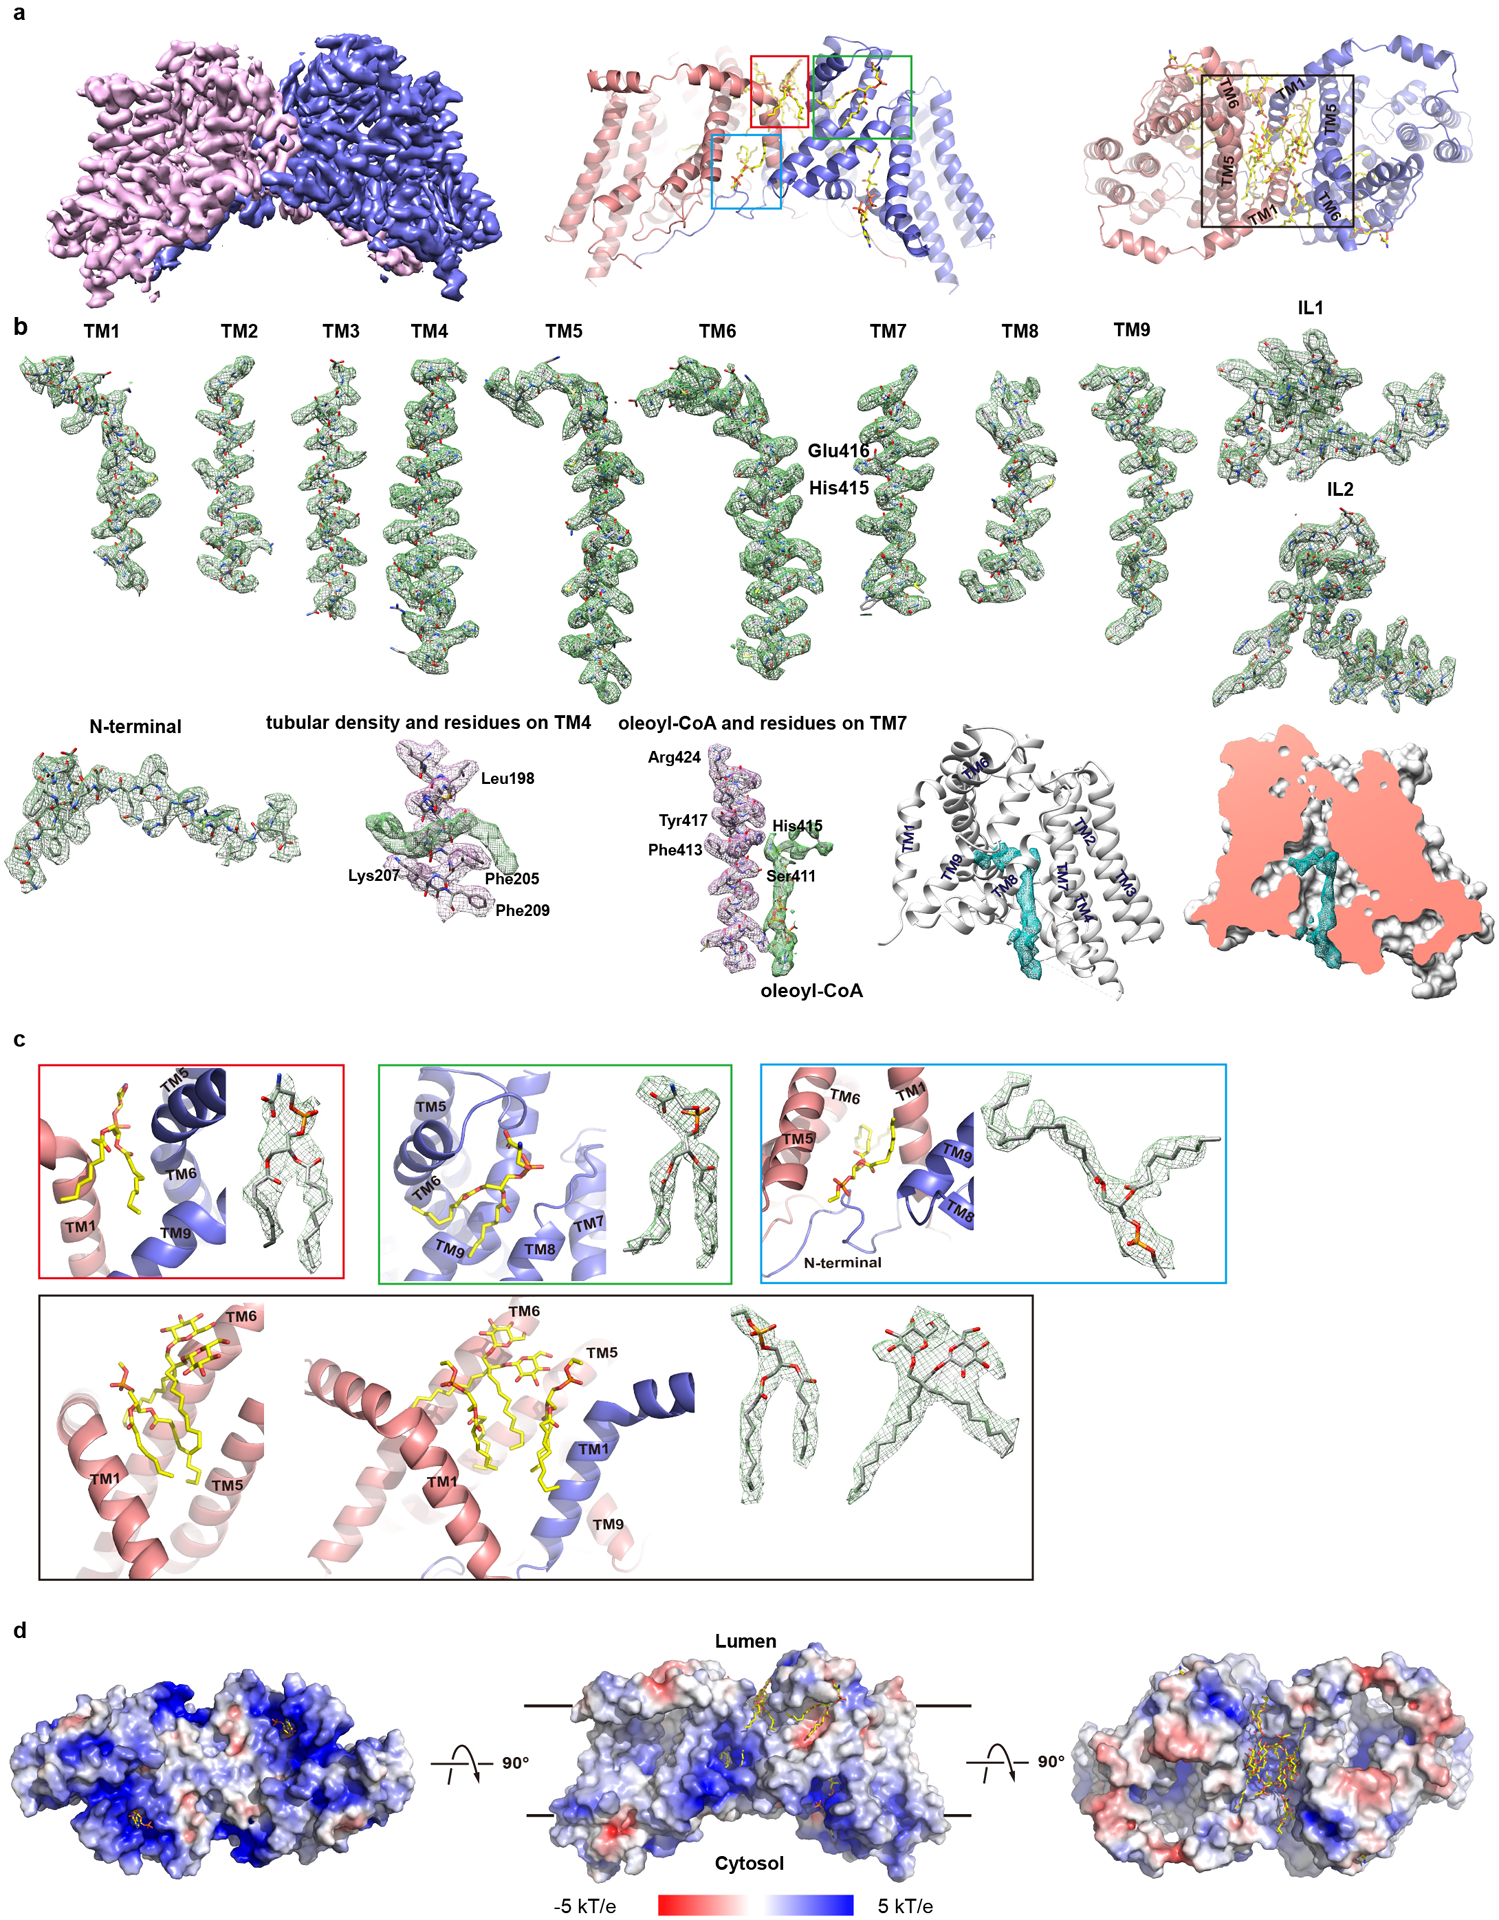
Extended Data Figure 4. Density maps and structural model of hDGAT1.

a. The overall map (left) and cartoon representation (right) of hDGAT1. b. Individual secondary structures of hDGAT1 shown as sticks, contoured in their density (green mesh). Density for oleoyl-CoA (green mesh) is shown at the same contour level as its neighboring helix, TM7 (red mesh). The tubular density (green mesh) is shown at the same contour level as its neighboring helix, TM4 (red mesh). c. Detailed view of each detergent/lipid molecule and its density. d. Electrostatic surface representations of hDGAT1 dimer in three orientations. The electrostatic potential is calculated using the APBS plugin41 from Pymol.
