
Figure 1. Manhattan plot for the total cutaneous melanoma meta-analysis.
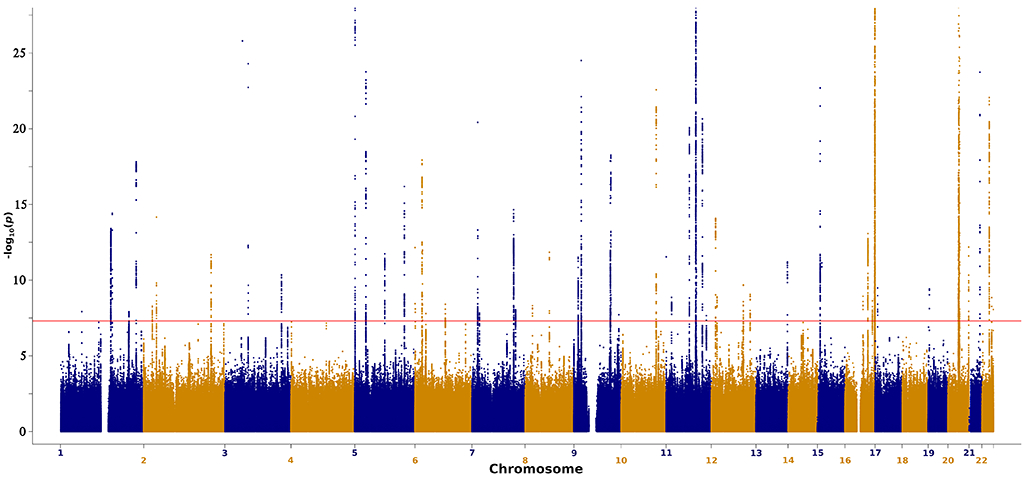
−log10 of two-sided P-values for SNPs derived from a fixed-effects inverse variance weighted meta-analysis of logistic regression GWAS (Y-axis) plotted against SNP chromosome positions for the total meta-analysis (36,760 melanoma cases and 375,188 controls; for full details of analysis and covariates included see the Online Methods). The y-axis is limited to −log10(1×10⁻²⁵) to truncate strong signals at loci such as MC1R and ASIP. The full plot is displayed in Extended Data Figure 2. To account for multiple testing, SNPs with a P-value less than 5×10⁻⁸ are deemed significant.