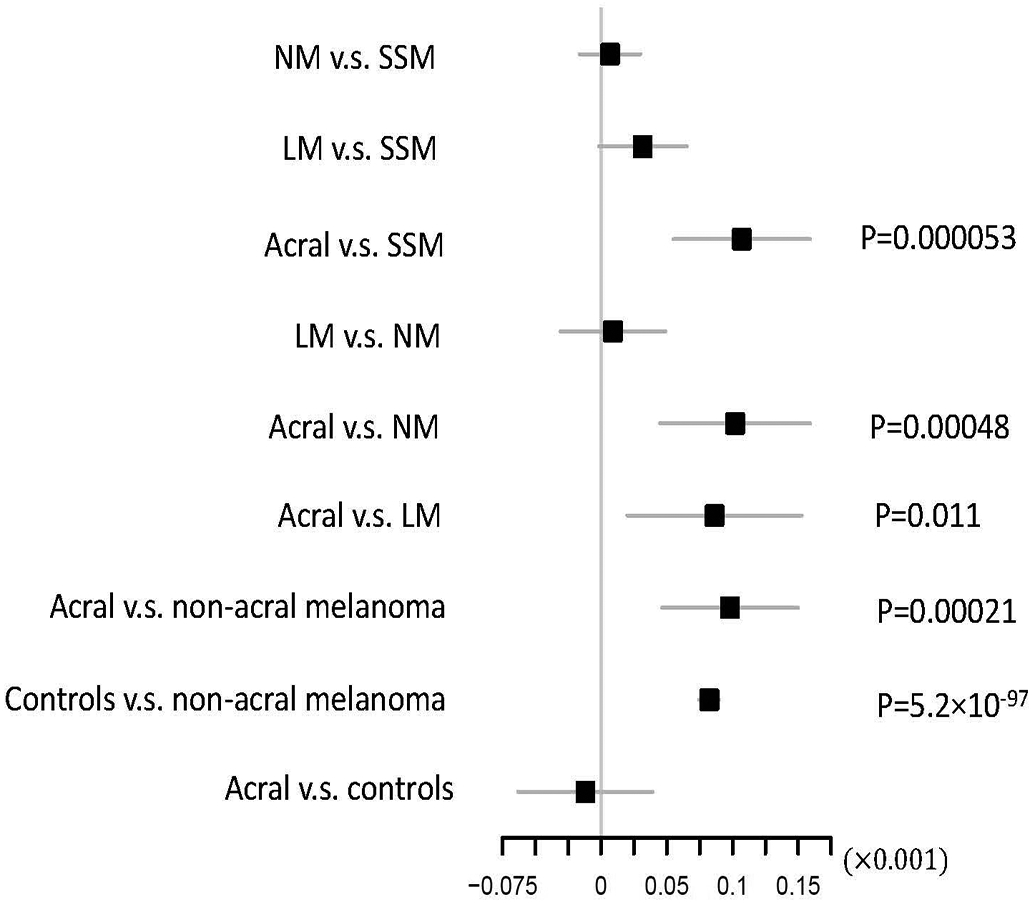
Extended Data Fig. 4. Distribution of pigmentation polygenic risk scores across melanoma histological subtypes.

The figure shows whether PRS defined based on SNPs associated with hair colour differ across CM histological types (Online Methods; SSM: superficial spreading melanoma; NM: nodular melanoma; LM: lentigo melanoma; Acral: acral lentiginous melanoma). The higher the PRS the lighter the hair colour. When comparing subtype 1 vs. subtype 2, we report the effect size for the linear regression of PRS on subtype 1, including study and principal components as covariates to control for population stratification. The regression coefficient, 95% confidence interval, and statistical significance are shown. The positive beta indicates the PRS is higher in subtype 2 (e.g., non-acral melanomas). This analysis included 9828 SSM, 2137 NM, 900 LM, 353 acral melanoma cases and 44676 controls. Two-sided t-statistic was used for testing significance. P-values reported were not adjusted for multiple comparison.
