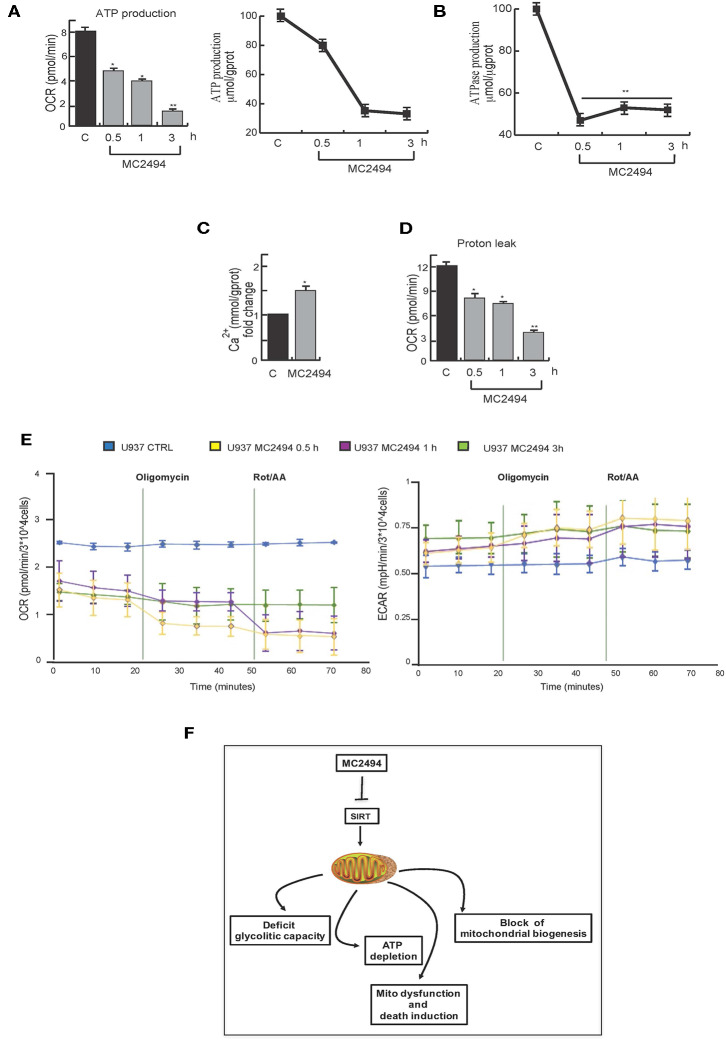
Figure 7.
(A) Orthogonal ATP assays. (B) ATPase assay. U937 were treated with MC2494 at 25 μM concentration for indicated times. (C) Intracellular calcium assay. U937 were treated with MC2494 at 25 μM concentration for 24 h. (D) Proton leak evaluation. (E) Seahorse ATP production assay, OCR and ECAR evaluation. U937 were treated with MC2494 at 25 μM concentration for indicated times. Values are mean ± standard deviation (SD) of biological triplicates. **p ≤ 0.01, *p ≤ 0.05 vs. control cells. (F) Schematic representation of MC2494 effects on mitochondrial biological activity.

