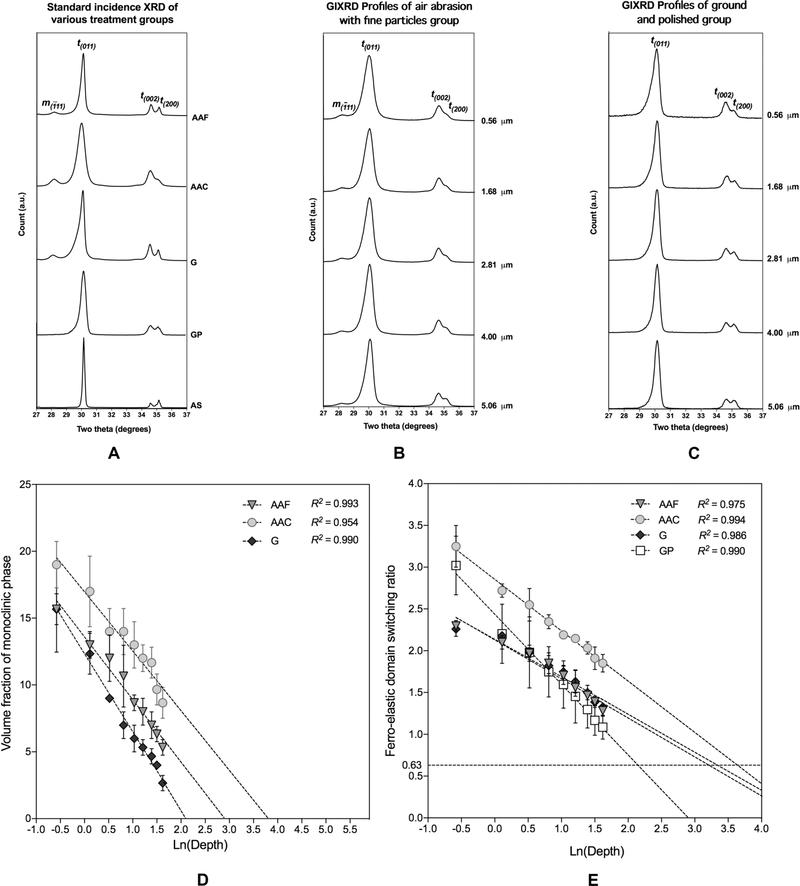
Figure 7.
(A) Standard incidence XRD profiles for various surface treatment groups. All treated groups exhibited ferro-elastic domain switching as indicated by a reversal in the relative intensities of the t(002) and t(200) tetragonal reflections. (B) GIXRD profile as a function of incidence angle after air abrasion with fine particles. (C) GIXRD profile as a function of incidence angle after grinding and polishing. (D) Monoclinic volume fraction as a function of depth measured by GIXRD. The depth of t-m phase transformation was calculated from semi-log linear regression, where graphs intercepted the x-axis at zero (monoclinic volume fraction was zero). (E) FDS as a function of depth measured by GIXRD. The depth of FDS was calculated from semi-log linear regression, where graphs intercepted the x-axis at 0.63, control value.

