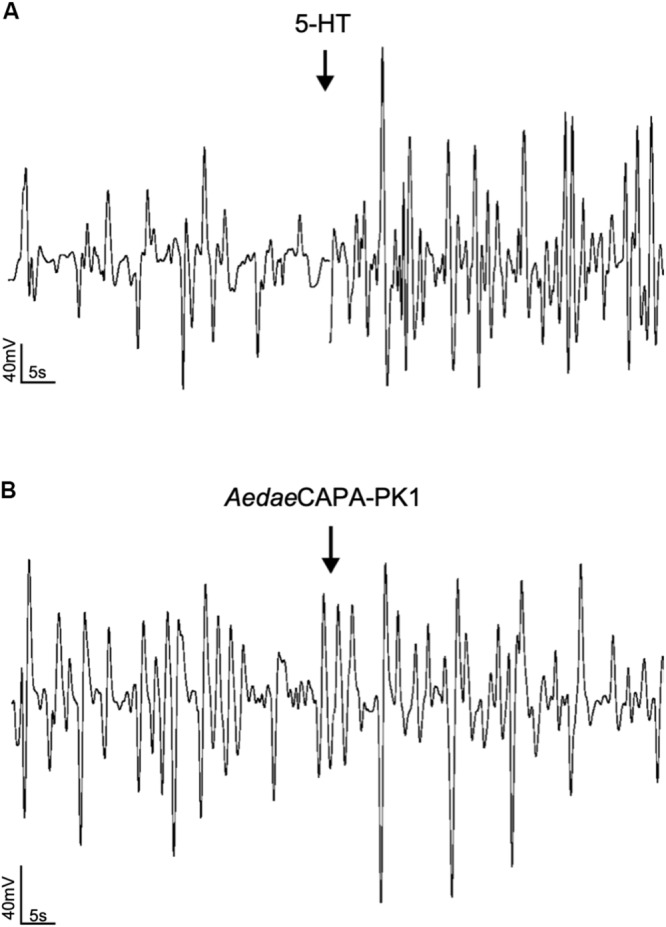
FIGURE 4.

Sample traces of 5-HT (A) and AedaeCAPA-PK1 (B) on spontaneous rectal contractions. Arrows indicate time of hormone application following baseline saline measurement. Contraction rate increased in response to 5-HT (A), whereas no change in activity was observed following AedaeCAPA-PK1 application (B).
