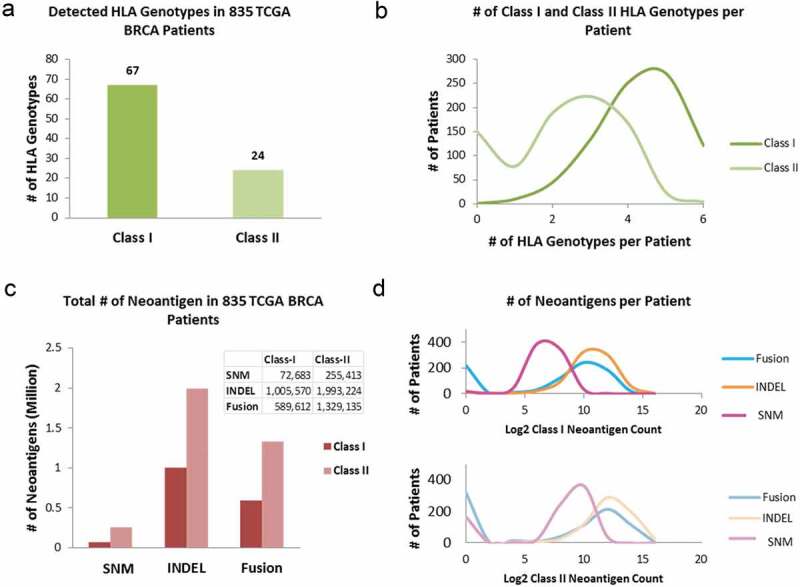
Figure 2.

HLA genotyping and neoantigen profiling in 835 TCGA BRCA tumors. (a) The number of unique HLA genotypes in the 835 TCGA BRCA patients. (b) Distribution of the number of class-I and class-II HLA genotypes per patient. (c) Total number of neoantigens in the BRCA cohort, stratified by: (i) type of somatic mutations: SNM, INDEL, and gene fusion from which neoantigens arose; and (ii) the class of HLA molecules neoantigens bind to. (d) The numbers of class-I (top panel) and class-II (bottom panel) neoantigens per patient, stratified by somatic mutation types of SNM, INDEL and Fusion. The x-axis is in Log2 scale.
