
Figure 1. The Impact of Treatment on Cessation Outcomes as a Function of Group.
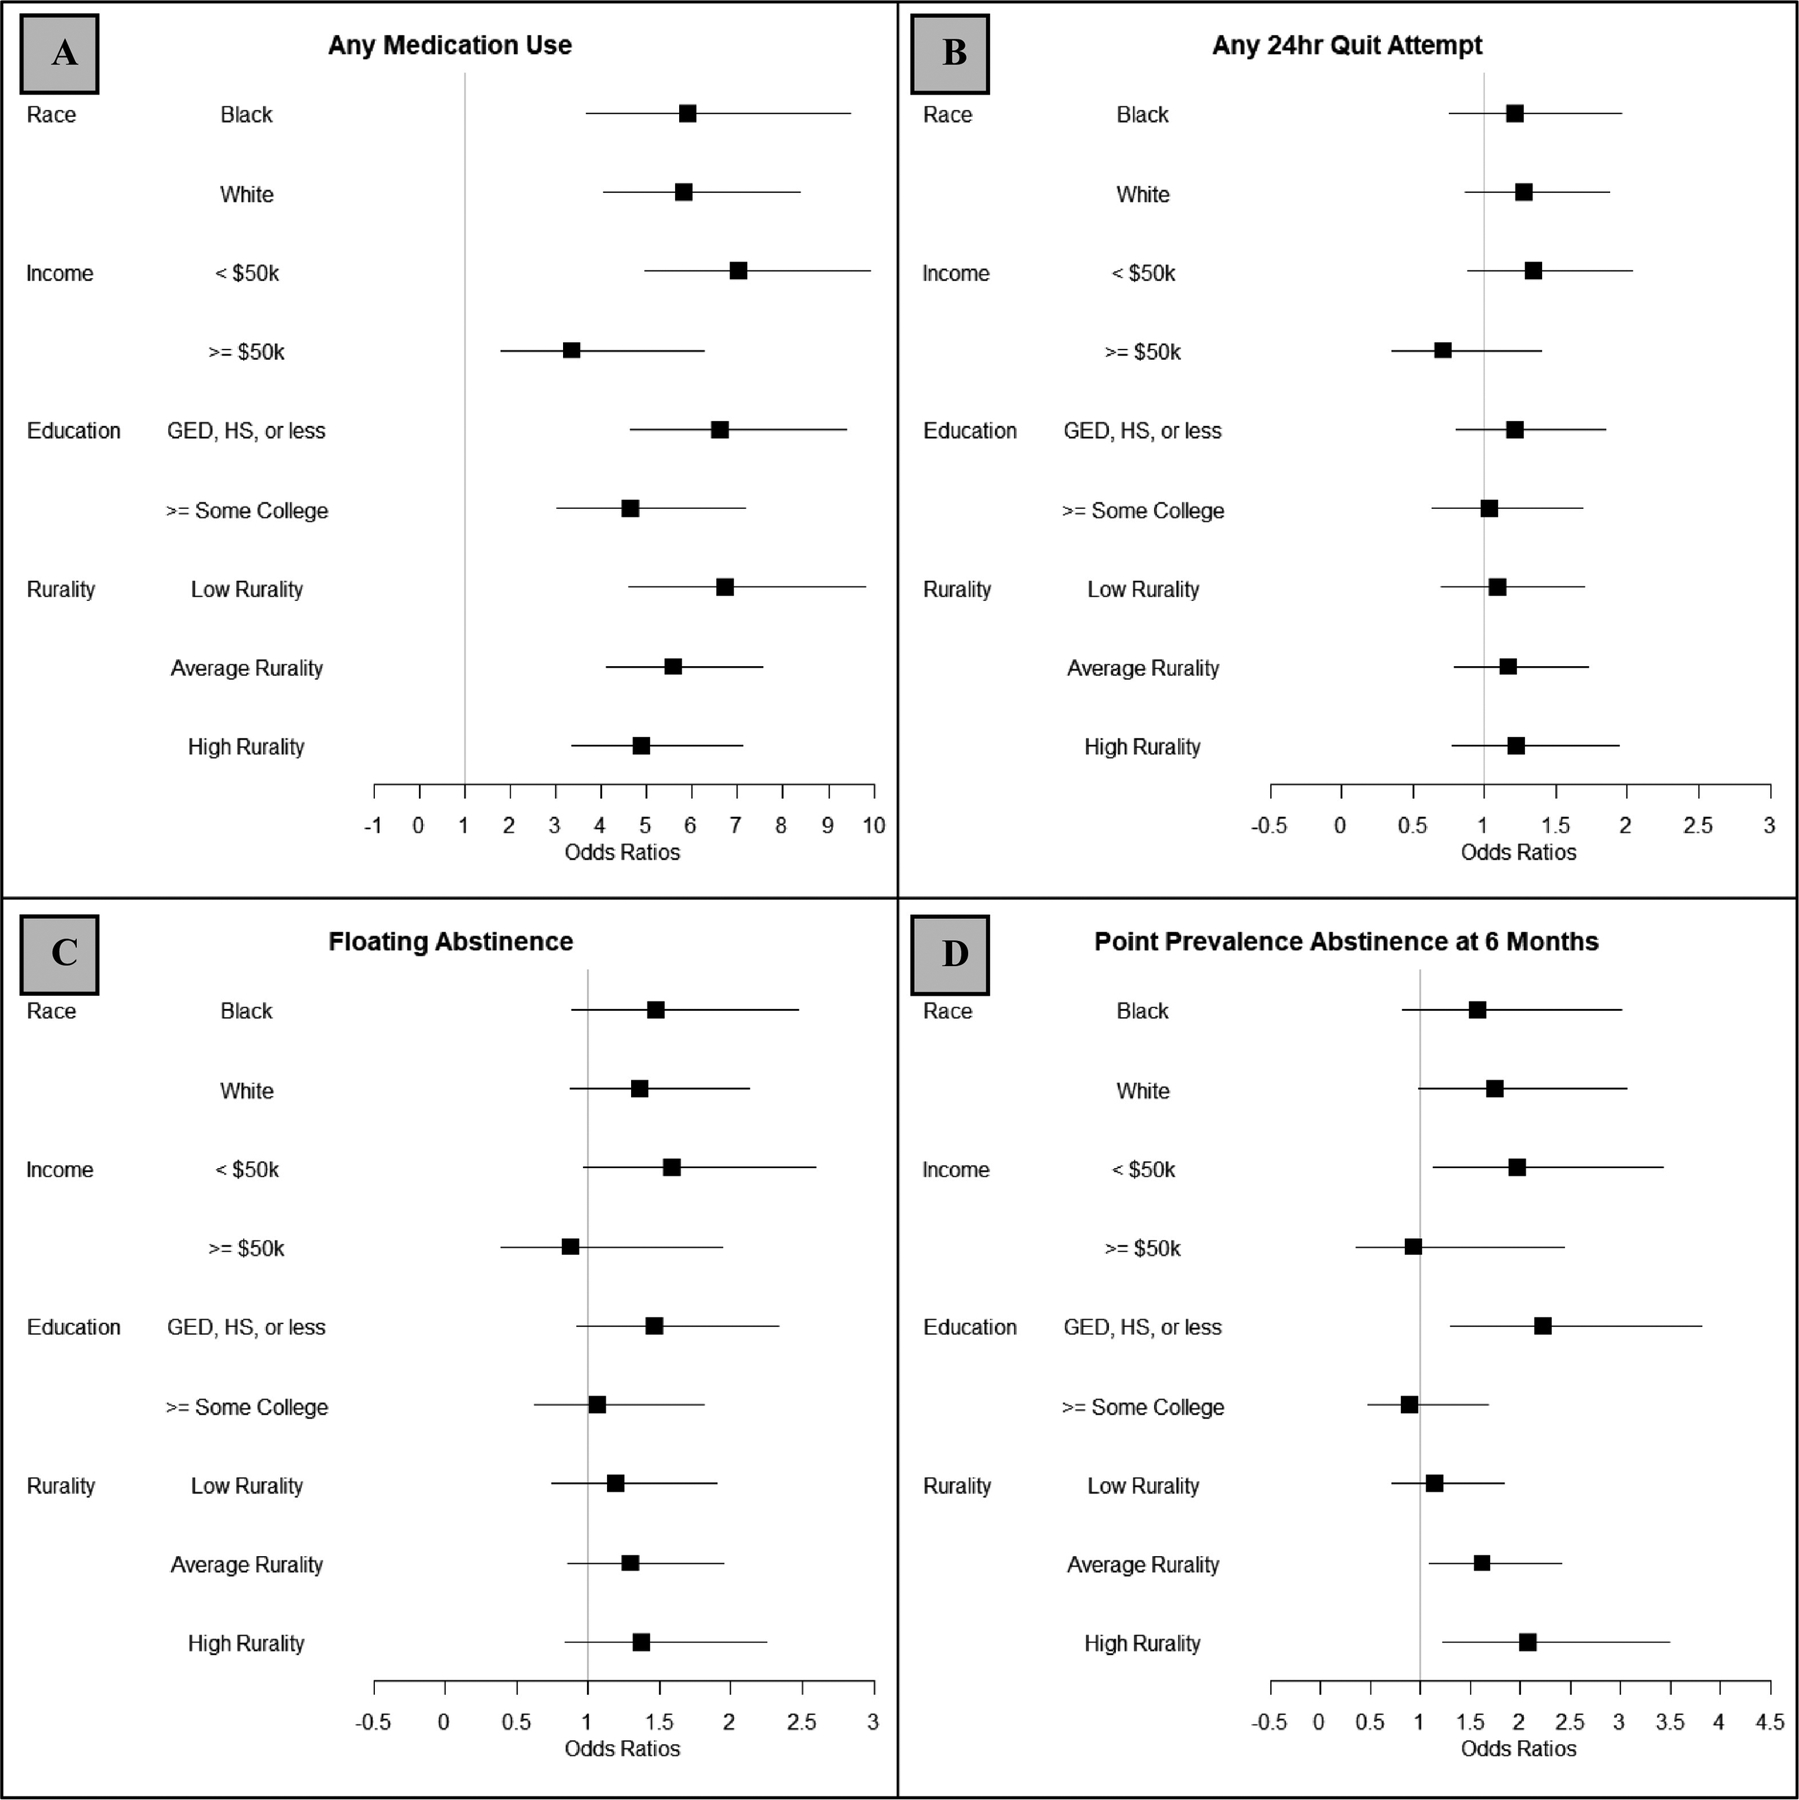
Note: Results are paneled for each cessation outcome: A) any medication use, B) any 24-hour quit attempt, C) floating abstinence, and D) 7-day point prevalence abstinence at 6-months. Odds ratios and accompanying 95% confidence intervals are presented within each demographic group as a function of NRT sampling vs. control (referent). Rurality was examined at the median rurality (average rurality) for the study sample as well as at the 75th (high rurality) and 25th (low rurality) percentiles.