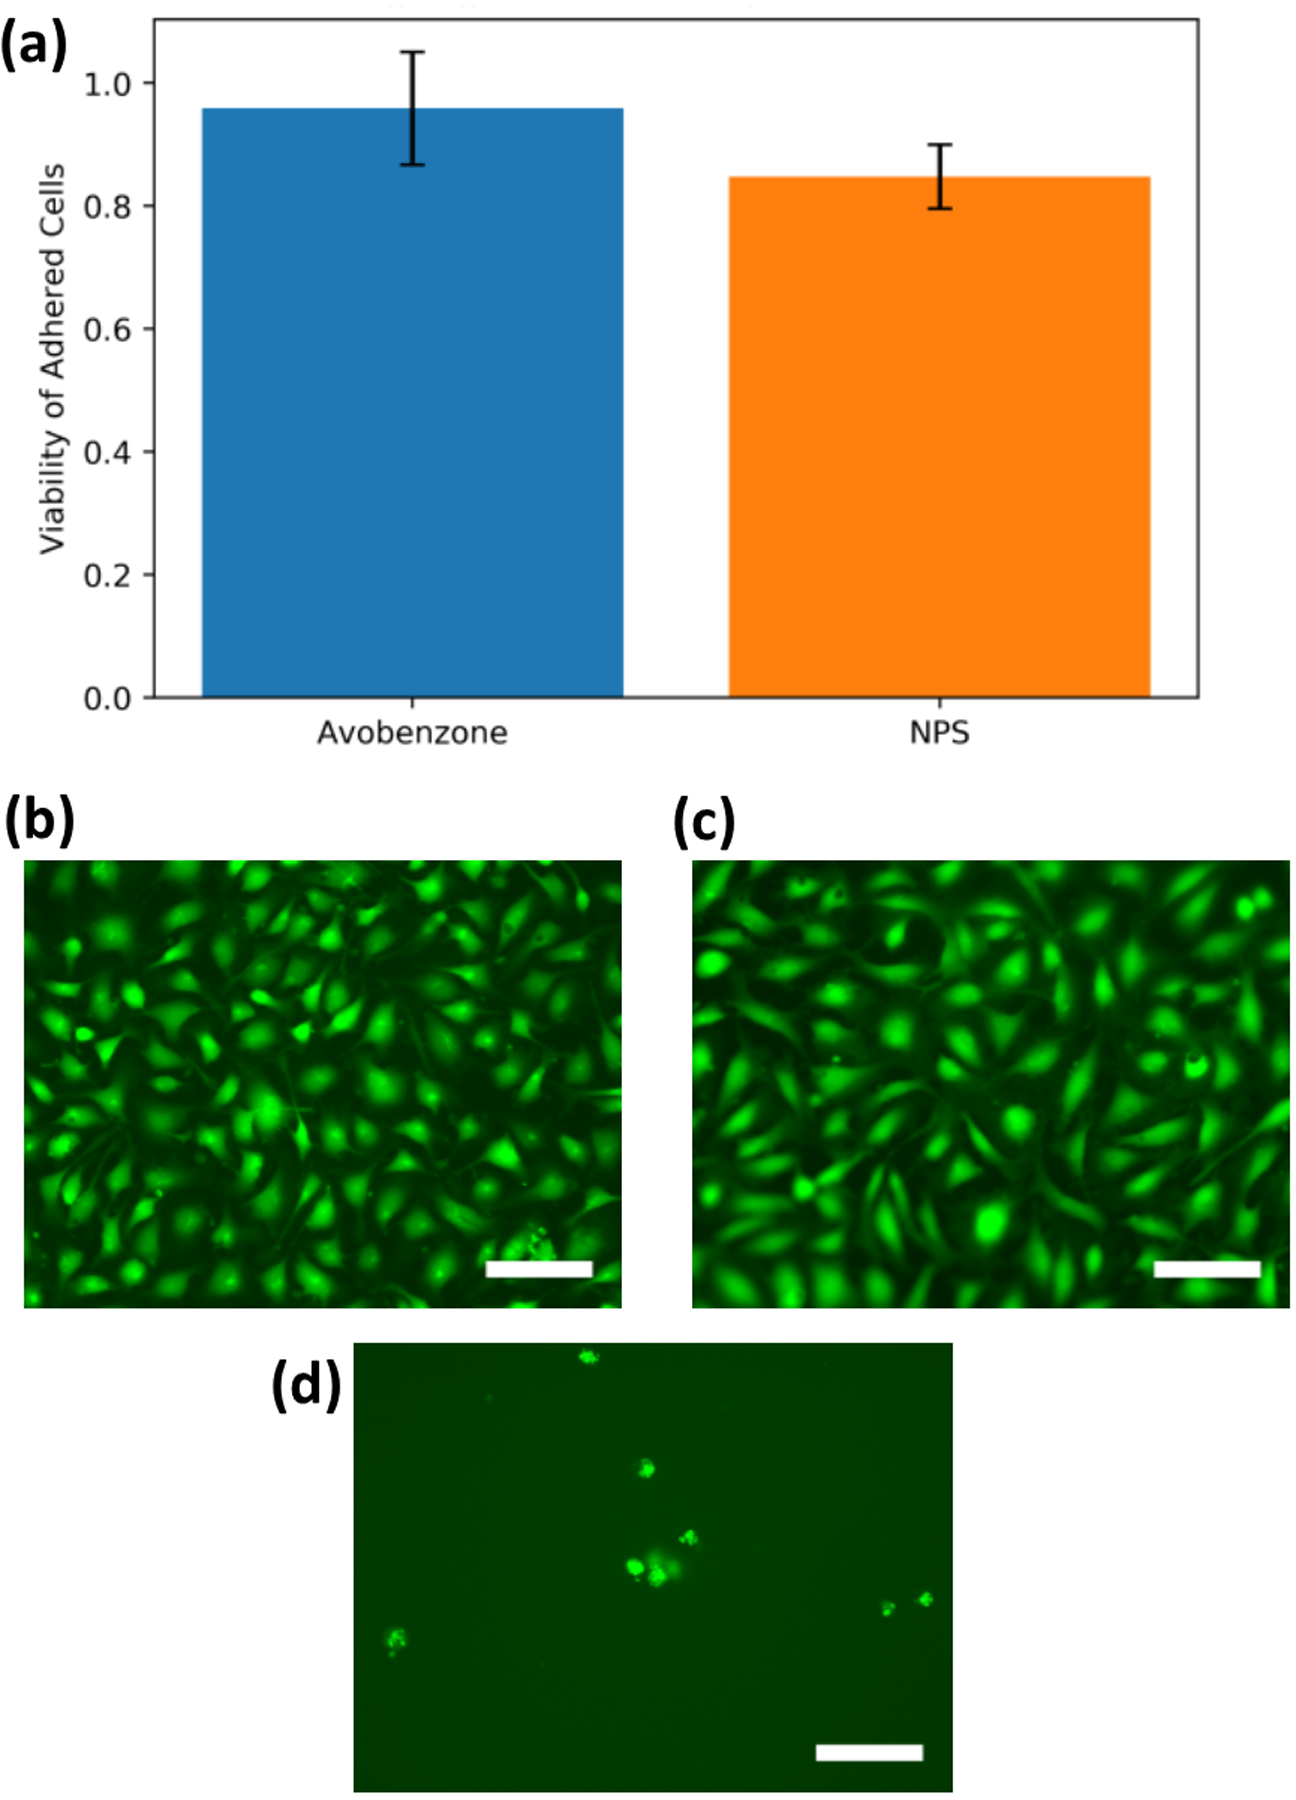
Figure 4:

(a) Cell viability of EA.hy926 cells adhered to plasma-treated A-PEGDA and NPS-PEGDA. Data are shown as the fractional surface coverage of the cells normalized to a TCPS control. Error bars indicate standard deviation. The average and standard deviation are, respectively, 0.959 and 0.092 for A-PEGDA and 0.848 and 0.052 for NPS-PEGDA. Images of adhered and stained EA.hy926 cells for plasma-treated (b) unwashed A-PEGDA and (c) washed NPS-PEGDA, and (d) washed NPS-PEGDA with no plasma treatment. Scale bars are 100 μm.
