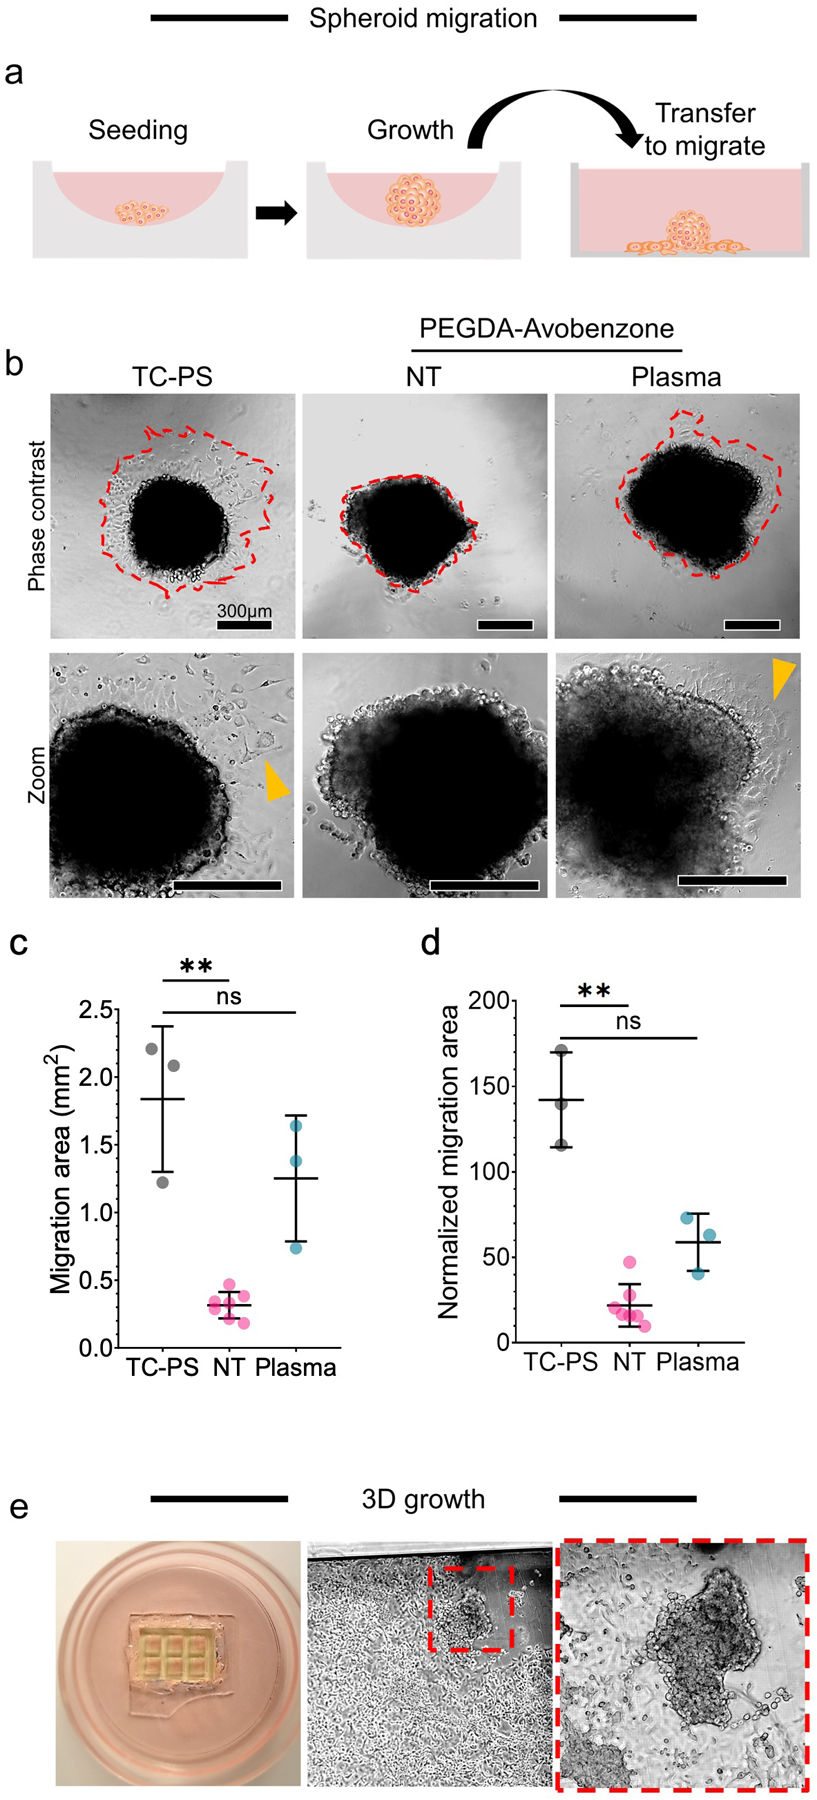
Figure 5:

Characterization of 3D growth and migration. a-d) migration of cells from spheroids in flat printed plates, where: a) workflow that includes transfer from low-adhesion seeding and growth well to a 3D printed A-PEGDA well; b) phase-contrast images of spheroids 24hr post-transfer to the plates (NT = no plasma treatment) where zoom images show migrated cells out of the spheroid (yellow arrow); and quantifications of cell migration according to Fig. 2 where c) is the migration area and d) is the migration area normalized to the spheroid area. Significance is based on the Kruskal-Wallis non-parametric test with sample size of 3 (TC-PS), 7 (PEGDA NT), and 3 (PEGDA + Plasma); bars indicate mean and standard deviation; points are observed individual values. e) 3D growth in printed A-PEGDA micro 6-well device. The red box shows 3D spheroid growth in epithelial cell (A549) culture.
