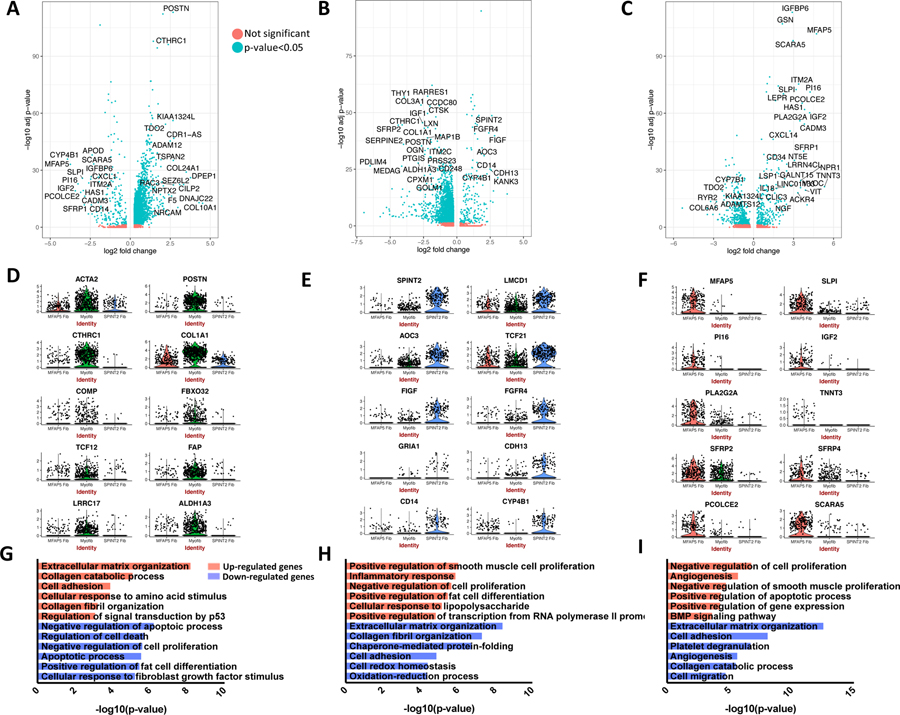
Figure 5.
Differential gene expression comparing each major fibroblast cluster (myofibroblast, SPINT2hi fibroblast, MFAP5hi fibroblast) to the other two. A-C Volcano plots include all differentially expressed genes with absolute value log2 fold change>0.5, and are colored by adjusted p-value <0.05 or not. D-F Violin plots demonstrate gene expression of selected distinguishing genes for each fibroblast subpopulation. G-I Enriched GO biological processes for the differentially expressed up-regulated and down-regulated genes for each comparison of one major fibroblast cluster to the other two. Functional enrichment analysis was performed using DAVID with all differentially expressed genes with adjusted p-value <0.05 and absolute value log2 fold change>0.5 included. (A), (D), and (G) display results of myofibroblast to SPINT2 hi fibroblast and MFAP5 hi fibroblast comparison. (B), (E), and (H) display results of SPINT 2 hi fibroblast to myofibroblast and MFAP5 hi fibroblast comparison. (C), (F), and (I) display results of MFAP5 hi fibroblast to myofibroblast and SPINT2 hi fibroblast comparison. DAVID, Database for Annotation, Visualization, and Integrated Discovery.

