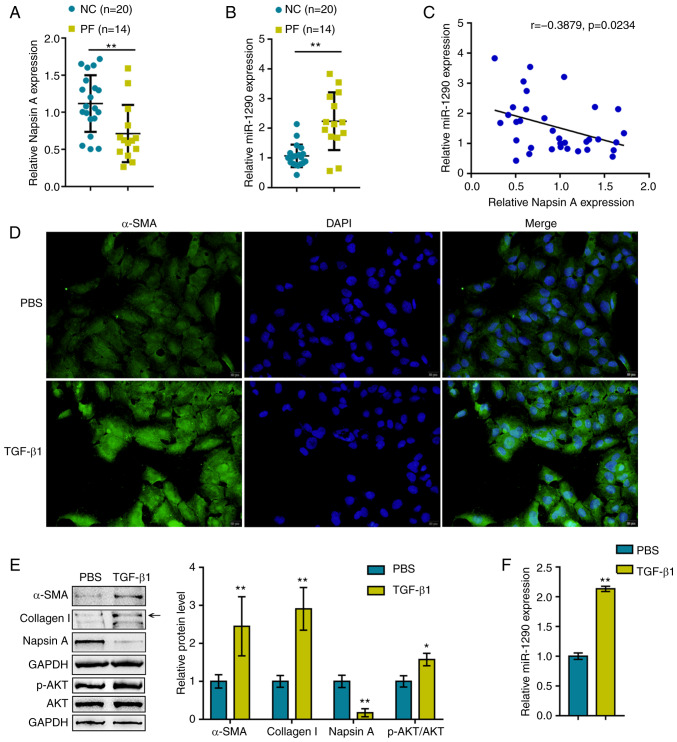
Figure 1.
miR-1290 expression is upregulated in blood samples from patients with pulmonary fibrosis and in TGF-β1-stimulated A549 cells. (A and B) miR-1290 and Napsin A expression levels in blood samples obtained from healthy volunteers (negative control) and patients with pulmonary fibrosis. (C) The correlation of miR-1290 and Napsin A expression in blood samples was analyzed by Pearson's correlation analysis. A549 cells were treated with TGF-β1 and examined for (D) α-SMA protein content (green) by immunofluorescence staining. (E) Protein levels of Napsin A, α-SMA, Collagen I, AKT and p-AKT were assessed by western blot analysis. (F) Expression of miR-1290 was assessed by RT-qPCR. *P<0.05 and **P<0.01 compared to the control. PF, pulmonary fibrosis.

