
Figure 2.
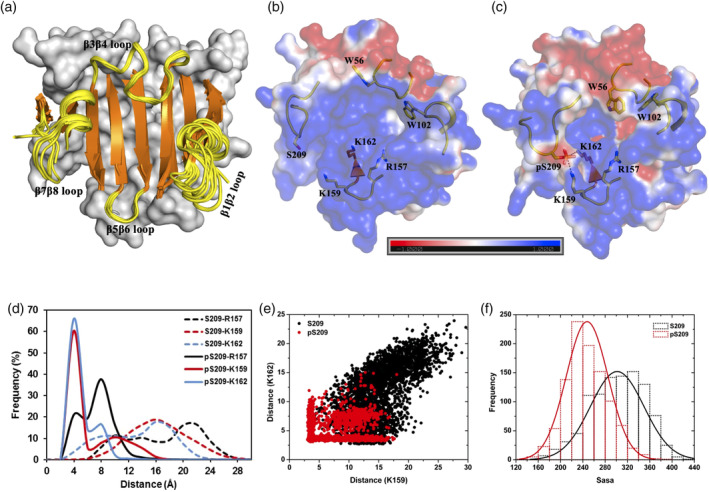
Cap‐free eIF4E structure and its phosphorylated derivative. (a) Superimposition of 11 distinct crystal structures of cap‐free state of human eIF4E (see Table S1 for PDB IDs). The eight beta strands (orange color) and the four connecting loop segments (yellow color and labeled) which form the cap‐binding interface are shown in cartoon representation. The rest of the protein is shown in surface representation in gray color. (b and c) Representative structures from MD simulations of the unphosphorylated and phosphorylated states of cap‐free eIF4E, respectively. The protein is shown in electrostatic surface representation that was created using the APBS plugin through the Pymol molecular visualization software (Schrodinger). A color gradient from blue to red represents the range of surface potential kT/e values from strongly positive (+1.0) to strongly negative (−1.0). Specific residues primarily from the four‐loop segments (displayed in yellow‐colored cartoon backbone) are shown in stick representation and labeled. The salt‐bridge tripartite network between K157‐pS209‐K162 is demonstrated explicitly with dashed lines. (d) Frequency distribution of the minimum distance between heavy atoms of specific residue pairs from MD simulations of the unphosphorylated (S209) and phosphorylated (pS209) states. (e) Scatter plot of the pair‐wise distance “K159 (NZ)‐S209/pS209 (OG)” and “K162 (NZ)‐S209/pS209 (OG)” from MD simulations of the unphosphorylated (S209) and phosphorylated (pS209) states. (f) Frequency distribution of solvent accessible surface area (Sasa) summed over a group of residues (D90, S92, F94, R112, L114, T116, G151, V153, N155, K162, A164, and W166) from MD simulations of unphosphorylated (S209) and phosphorylated (pS209) states