
Figure 7.
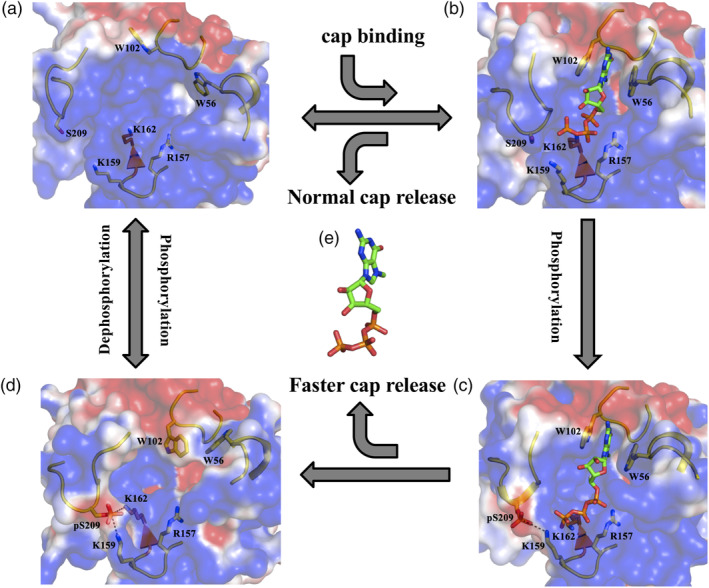
Molecular model for the phosphorylated regulation of eIF4E: mRNA‐cap interaction. Representative structural state of (a) cap‐free, (b) m7GTP bound, (c) S209 phosphorylated m7GTP bound and (d) S209 phosphorylated cap‐free eIF4E. The salt‐bridge between K159‐pS209 and K162‐pS209 is demonstrated explicitly with dashed lines. The arrows indicate the transition between different states, binding and release of the m7GTP cap accompanying the phosphorylation/dephosphorylation events, which are accordingly labeled. (e) Stick representation of the m7GTP cap‐analog