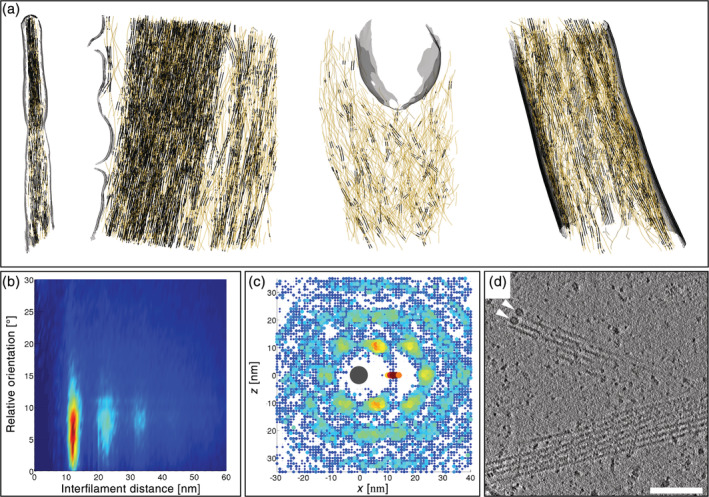
FIGURE 2.

Nanoscale architecture of cellular actin bundles explored by cryo‐electron tomography. (a) Three‐dimensional (3D) architecture of peripheral actin networks in Ptk2 cells. From left to right: actin filaments in a filopodium, a stress fiber, a cytoplasmic Listeria comet tail, and a Listeria protrusion. Actin filaments are shown in yellow with bundled portions displayed in black. The plasma membrane and the cell wall of Listeria are shown in grey. (b) 2D histogram showing distances between filopodial actin filaments as a function of their relative orientation, and revealing a population of parallel filaments with center‐to‐center distances of ~12 nm. Second‐ and third‐order peaks are visible indicating long‐range order. Reproduced from reference [77]. (c) Packing analysis for actin filaments belonging to a filopodium revealing a hexagonal arrangement of neighboring filaments. Reproduced from reference [77]. (d) Slice through a tomogram of a neuronal process acquired with the Volta phase plate. Two annular structures (white arrowheads) resembling formin homology 2 domains are visible at the tip of actin filaments. The periodicity of the helical repeat of actin filaments is evident in the lower bundle. Scale bar: 100 nm. Reproduced with permission from reference [78], copyright (2015) Elsevier
