FIGURE 6.

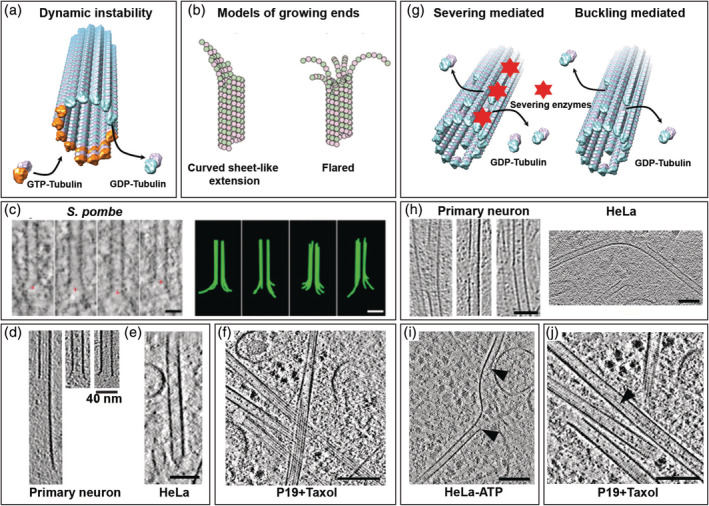
Lattice plasticity of microtubules (MTs) revealed by cryo‐electron tomography. (a) Schematic representation of MT dynamic instability. (b) Proposed models of MT growing ends. Reproduced with permission from reference [155], copyright (2018) Rockefeller University Press. (c) Flared morphology of growing MT plus ends observed in Schizosaccharomyces pombe cells. Scale bars: 50 nm. Reproduced with permission from reference [156], copyright (2018) Rockefeller University Press. (d) Curved extension (left), flared (middle), or blunt (right) MT plus ends observed in hippocampal neurons. Reproduced from reference [157]. (e) Capped MT plus end in a mitotic HeLa cell. Scale bars: 40 nm. (f) Sheet‐like extensions of MT plus ends observed in a Taxol‐treated HeLa cell. Scale bars: 100 nm. (g) Proposed mechanisms of lattice defects in MTs. (h) Lattice defects observed in primary neurons (reproduced from reference [157]) and a HeLa cell (reproduced from reference [123]). Scale bar: 40 nm. (i) Protofilament (PF) segments lost in an adenosine triphosphate (ATP)‐depleted HeLa cell indicated by black arrowheads. Scale bar: 100 nm. Reproduced from reference [123]. (j) 13‐to‐14 PF transition (black arrowhead) observed in a Taxol‐treated cell. Scale bars: 100 nm. GTP, guanosine triphosphate; GDP, guanosine diphosphate
