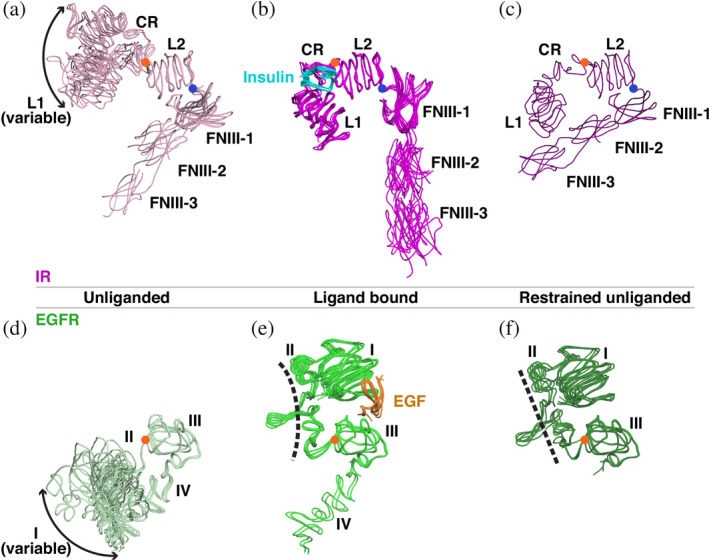
FIGURE 2.

The three “states” of the IR and EGFR family ECR structures. (a–c) Structures of the IR ECR are grouped based on the orientations of the L1‐CR and FNIII‐1/2/3 modules relative to L2, which was used to align all structures. (a) The unliganded states (light pink) have an “open” L1‐CR‐L2 module and a “closed” L2‐FNIII‐1 relationship. The location of the L1‐CR module with respect to L2 is variable (denoted by the double‐headed arrow), reflecting flexibility in this region of the molecule. Orange circles mark the axes of rotation of L1‐CR with respect to L2, and blue circles mark the axis of rotation of L2 with respect to FNIII‐1—which define transitions between the different states. (b) When insulin (cyan) is bound, the L1‐CR‐L2 module is forced into a “closed” conformation, and the FNIII‐1/2/3 module becomes oriented away from L2 (magenta) in an “open” conformation. (c) The “restrained unliganded” state (purple), which is seen only in asymmetric dimers in which one protomer is liganded and the other not. The L1‐CR‐L2 module is “open” in this state, with L1 fixed by state‐specific interactions with FNIII‐2 in the same chain. This state is also seen in the asymmetric IGF1‐R structure. (d–f) The three states of EGFR ECR. (d) Unliganded structures (pale green) show “open” domain I–III conformations with a variable domain I location. (e) When EGF (orange) binds, domains I and III are drawn together into a “closed” conformation by interacting simultaneously with the same ligand. (f) The “restrained unliganded” conformation (dark green) seen in asymmetric dimers of EGFR. Note the straight domain II (dashed line) compared to the bent domain II in the ligand bound state shown in (e). CR, cysteine‐rich; ECR, extracellular region; EGF, epidermal growth factor; EGFR, epidermal growth factor receptor; FNIII, fibronectin type III; IR, insulin receptor
