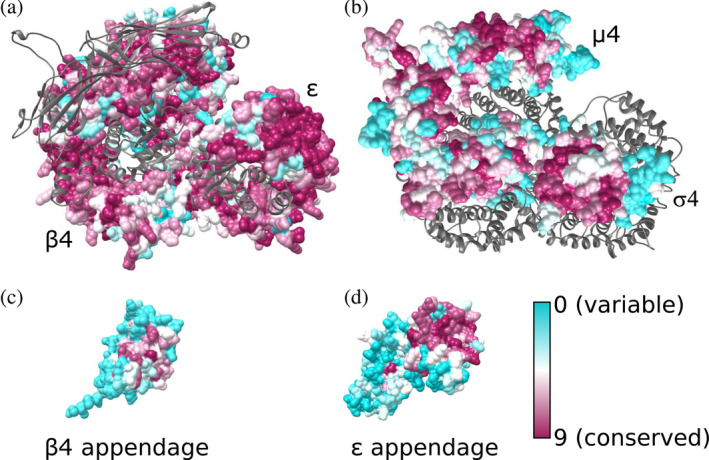
FIGURE 2.

Evolutionary conservation of the AP‐4 core and appendage domains. Residues are colored from cyan to dark magenta based on conservation scores calculated using ConSurf. AP‐4 core with conservation scores mapped to residues are shown for (a) β4 and ε subunits with μ4 and σ4 shown as gray ribbons; (b) μ4 and σ4 subunits with β4 and ε subunits shown as gray ribbons; (c) the β4 appendage domain; and (d) the ε appendage domain. AP‐4 views in (a) and (b) are shown as top‐down views from the membrane. AP‐4, adapter protein complex 4
