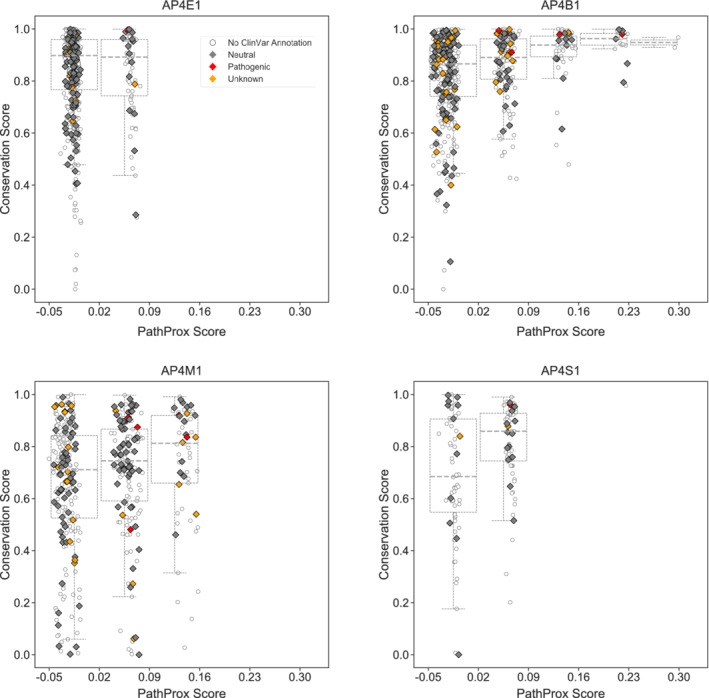
FIGURE 7.

Conserved AP‐4 residues tend to exhibit higher PathProx scores. The PathProx score and a normalized conservation score derived from ConSurf for every residue in each AP‐4 subunit are plotted. Pathogenic variants are annotated in red; neutral/benign variants are shown in gray; and variants of unknown significance (VUS) are shown as empty circles. Boxplots are drawn after binning PathProx scores into equal size units of 0.07 to illustrate how conservation scores increase with increasing PathProx scores. Neutral/benign variants and VUS were compiled from ClinVar annotations. Conservation scores of 1 indicate the highest conservation while lower scores indicate highly variable positions across species. Higher PathProx scores indicate a greater average proximity to pathogenic variation compared with benign variation. AP‐4, adapter protein complex 4
