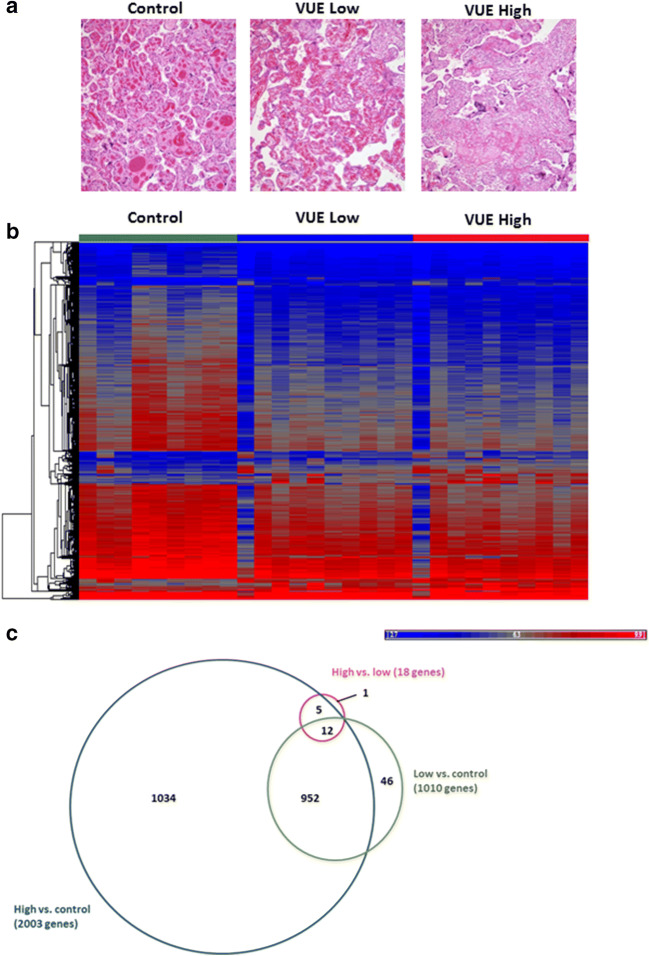
Fig. 2.
Gene expression changes based on VUE severity. (A) Representative H&E stain used for micro dissection of intermediate vs. high VUE in the same tissue sample. (B) Heat map demonstrating up (red) and down (blue) regulation of genes in VUE lesions as a group average with low and high infiltration compared to control (fold change >2; p value ≤0.05). (C) Proportional Venn diagram demonstrating the number of genes shared and different in control, low and high VUE placentae

