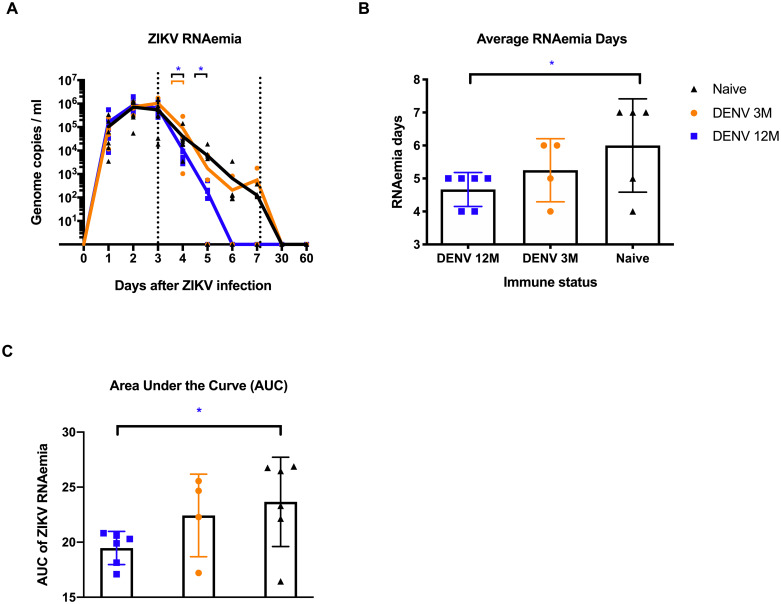
Fig 2. Zika RNA kinetics in serum and RNAemia days per cohort.
RNAemia is affected by the period of time between exposures. In all panels, animals exposed to DENV 12 months before ZIKV infection are in blue, while animals exposed to DENV 3 months before are in orange. Naïve animals are in black. (A) ZIKV genome copies/mL in serum. ZIKV replication was detected in serum during the first 7 days after infection, and then on days 30 and 60 p.i. Statistically significant differences were observed using unpaired multiple t tests (*P<0.05). Genome copies per mL are shown logarithmically. (B) Average RNAemia days were calculated using the following formula: total viremia days divided by total possible viremia days and are expressed as percentage. The obtained values were placed in a contingency table. (C) Area under the curve (AUC) was calculated for individual values. Statistically significant differences of viremia days were calculated using a two-sided Fisher’s exact test and multiple t tests (*P<0.05). Colored stars represent a significantly different group, while colored lines represent the group that it is compared to.

