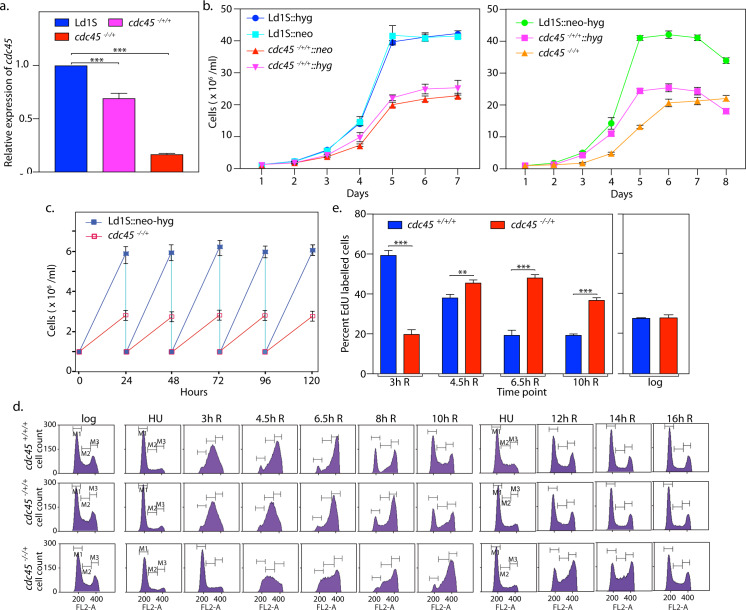
Fig 1. Depletion of Cdc45 causes growth and cell cycle aberrations.
a. Analysis of cdc45 expression in genomic knockout lines using real time PCR analysis. Tubulin served as internal control. cdc45-/+/+ refers to cdc45-/+/+::hyg cells. The average of data from three experiments is presented here. Error bars represent standard deviation. Two-tailed student’s t-test was applied: *** p < 0.0005. b. Analysis of growth of Cdc45-depleted cells. Growth was initiated at 1x10⁶ cells/ml, from stationary phase cells. Left panel: single allele replacement lines compared to control cells. Ld1S::hyg and Ld1S::neo are control Ld1S cells harboring the hygr and neor genes respectively, previously found to grow at rates comparable to wild type Ld1S cells. Right panel: double allele and single allele replacement lines compared to control cells. Ld1S::neo-hyg are control Ld1S cells expressing both neor and hygr casettes, previously found to grow at rates comparable to wild type Ld1S cells. In each case three experiments were set up in parallel and the graphs represent average values, with error bars representing standard deviation. c. Determination of generation time of double allele replacement cells cdc45-/-/+ in comparison with control Ld1S::neo-hyg cells. Growth initiated at 1x10⁶ cells/ml from exponentially growing promastigotes, and cells diluted to 1x10⁶ cells/ml every 24 hours. Average of three experiments are plotted, and error bars depict standard deviation. d. Flow cytometry analysis of Cdc45-depleted cells in comparison with control cells. Cells were synchronized at G1/S by HU treatment and then released into S phase. Time-points at which cells were sampled are indicated above each column of histograms e.g. 3h R signifies 3 hours after release from HU. M1, M2 and M3 gates represent cells in G1, S and G2/M respectively. 30000 events were counted in each case. cdc45+/+/+—Ld1S::neo-hyg cells. cdc45-/+/+—cdc45-/+/+:: hyg (heterozygous) knockout cells. cdc45-/-/+—cdc45 double allele knockout cells. The experiment was done thrice, and one data set is presented here. The percentage of gated cells in each of the cell cycle stages (G1, S and G2/M) from all three experiments are tabulated in S1 Table. e. HU-treated cells were released into S phase and 1 ml aliquots pulsed with EdU for 15 min. Left panel: Pulsing with EdU 3 hours, 4.5 hours, 6.5 hours and 10 hours after release. Right panel: Pulsing logarithmically growing cells with EdU. cdc45+/+/+—Ld1S::neo-hyg cells. Data presented in bar chart are average of three experiments and error bars represent standard deviation. Two-tailed student’s t-test was applied: **p < 0.005, ***p < 0.0005.

