
Figure 4: Distributions of old histone-enriched H3K27me3 and new histone-enriched H3K14Ac on Kc cell-derived chromatin fibers.
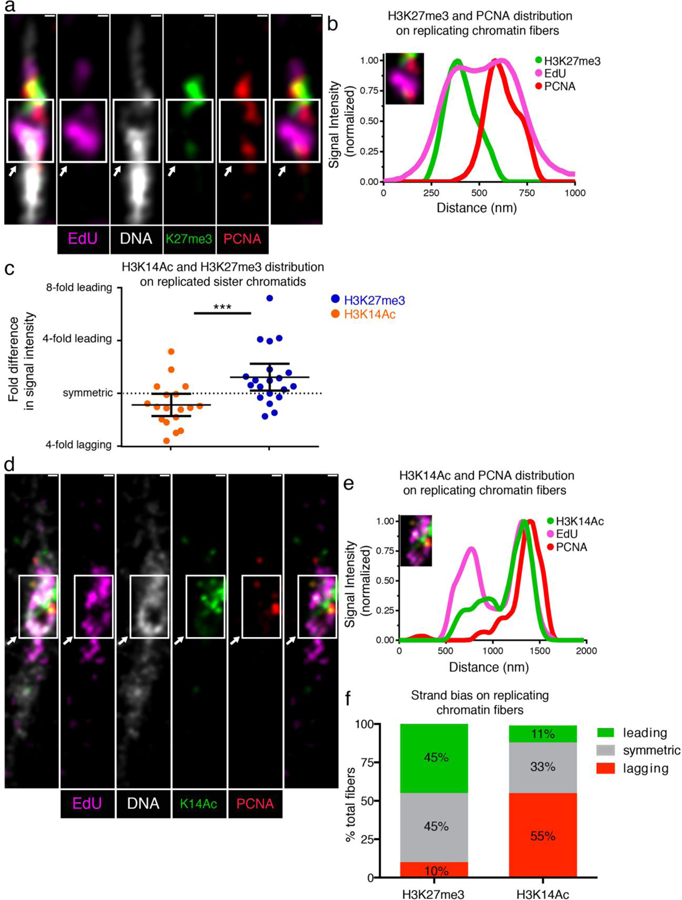
(a) Airyscan image of chromatin fiber labeled with EdU showing H3K27me3 and PCNA distributions at a replicative region on Kc cell-derived chromatin fiber. The transition from single to double fibers colocalizes with the EdU incorporation site (arrow). (b) Line plot shows PCNA, H3K27me3 and EdU distribution across the replicative region (solid box). (c) Quantification of the log2 ratios of H3K27me3 fluorescence intensity at: PCNA-depleted sister chromatid/PCNA-enriched sister chromatid (Average fold enrichment at the PCNA-depleted leading strand = 1.52; n = 20); and log2 ratios of H3K14Ac fluorescence intensity at: PCNA-depleted sister chromatid/PCNA-enriched sister chromatid (Average fold enrichment at the PCNA-enriched lagging strand = 1.34; n = 18). Individual data points and mean values are shown. Y-axis is with log2 scale. Error bars represent 95% confidence intervals. *** P < 10−3, Mann-Whitney U two-sided test (P = 0.0008), Mann-Whitney U score 69.0. (d) Airyscan image of chromatin fiber labeled with EdU showing H3K14Ac and PCNA distribution. The arrow indicates the replication region. (e) Upper line plot shows PCNA, H3K14Ac and EdU distribution across the replicating region (solid box). (f) Classification of PCNA-labeled fibers into leading strand-enriched (inter-sister ratio >1.4-fold), lagging strand-enriched (inter-sister ratio < −1.4) and symmetric (−1.4 < inter-sister ratio < 1.4) for H3K27me3 and H3K14ac. Scale bar in (a) and (d): 250 nm.