
Figure 5: Comparison of histone distribution patterns in different systems using distinct methods.
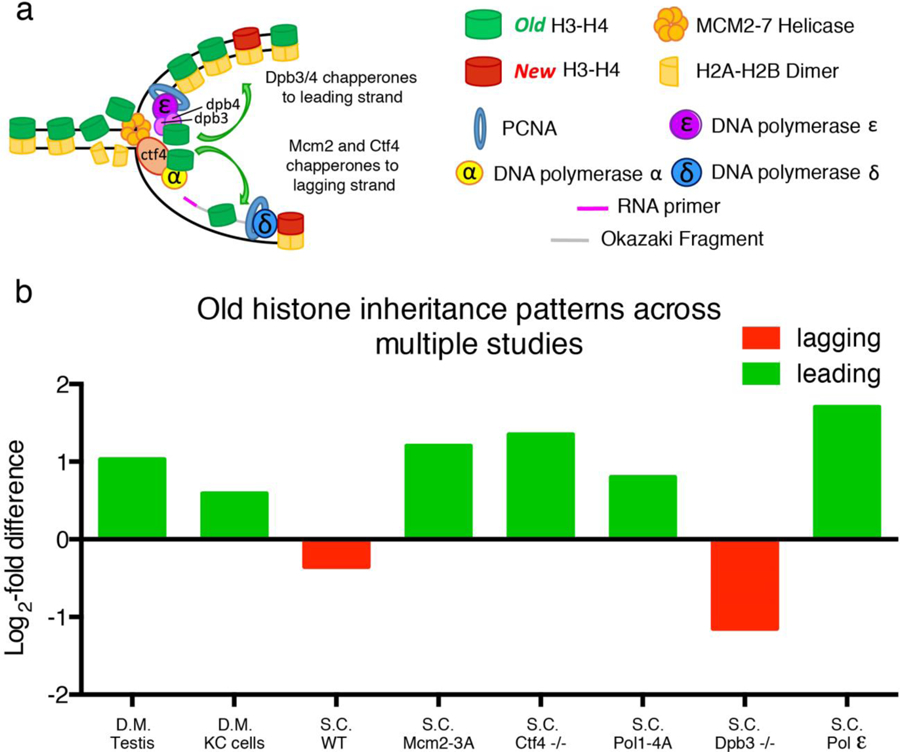
(a) A cartoon shows molecular players responsible for histone incorporation at the replication fork. (b) Bar graphs compare log2-fold enrichment of old histone on leading versus lagging strand in different systems under different experimental conditions. S.C. = Saccharomyces cerevisiae; D.M. = Drosophila melanogaster; WT: wild-type; −/−: homozygous loss-of-function mutant. MCM2–3A indicates a mutant MCM2 protein unable to properly chaperone histones. POL1–4A indicates a mutant Pol α unable to properly tether Ctf4. S.C. Pol ε indicates distribution of the leading strand Polymerase epsilon on sister chromatids. Green bars indicate biases towards the leading strand and red bars indicate biases towards the lagging strand.