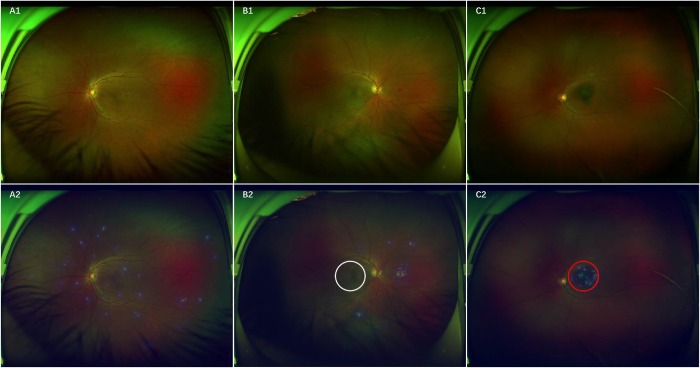
Figure 7.
Ultra-widefield fundus images and corresponding heatmaps showing typical true-positive cases. A, RH shown in A1 corresponds to the highlighted regions displayed in heatmap A2. B, RH without involving the macula manifested in B1 is present in the highlighted regions outside the white circle visualized in heatmap B2. C, RH within the area of the macula presented in C1 is present in the highlighted regions in the red circle shown in heatmap C2.

