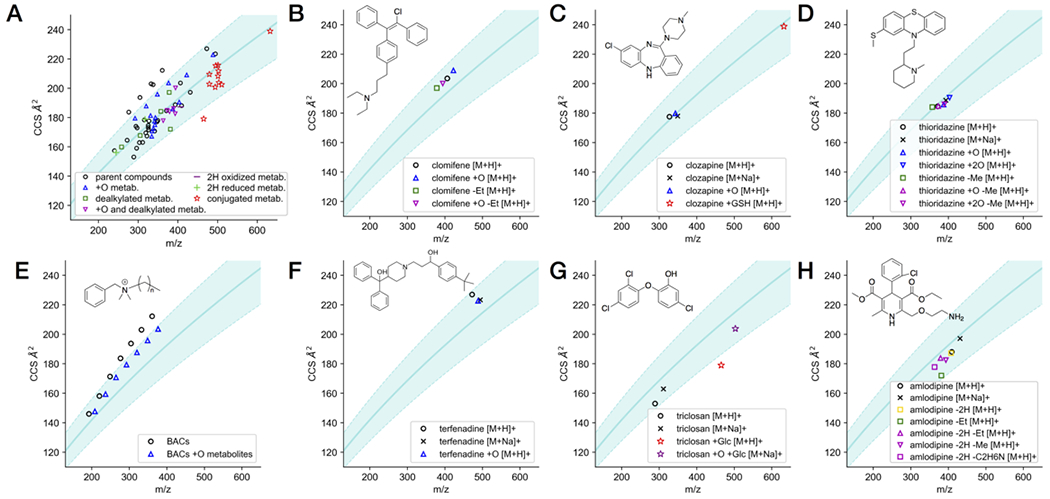
Figure 2.

(A) IM-MS conformational space plot showing the 78 CCS values of 19 parent drugs and their 37 metabolites. (B-H) CCS values of the parent and metabolites of selected individual drugs in IM-MS plot. All data points represent the average of three measurements. The curve and shade in the background of the plot represents the power fit and the ± 10% range of the 1440 drug and drug-like CCS values we reported previously.20
