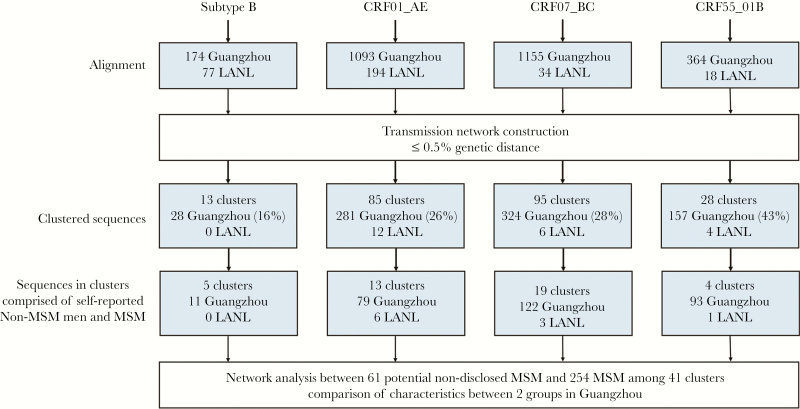
Figure 1.
Data processing flow chart. The number of sequences at each stage of analysis were shown. Only clusters with at least 1 Guangzhou sequence were counted in the transmission network. Percentages were calculated with the total number of sequences from that human immunodeficiency virus-1 subtype or genotype as the denominator. LANL, Los Alamos National Laboratory; MSM, men who have sex with men.

