FIGURE 3.

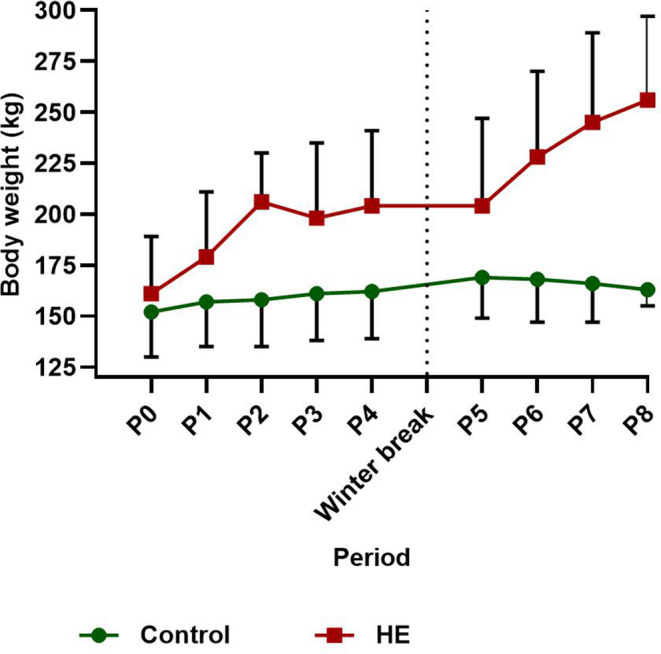
Mean ± SD body weight for the control and high‐energy (HE) group per dietary period for year 1 (control n = 4, HE n = 7; periods 0‐4) and year 2 (control n = 6, HE n = 4; periods 5‐8) with a hay‐only winter break in between

Mean ± SD body weight for the control and high‐energy (HE) group per dietary period for year 1 (control n = 4, HE n = 7; periods 0‐4) and year 2 (control n = 6, HE n = 4; periods 5‐8) with a hay‐only winter break in between