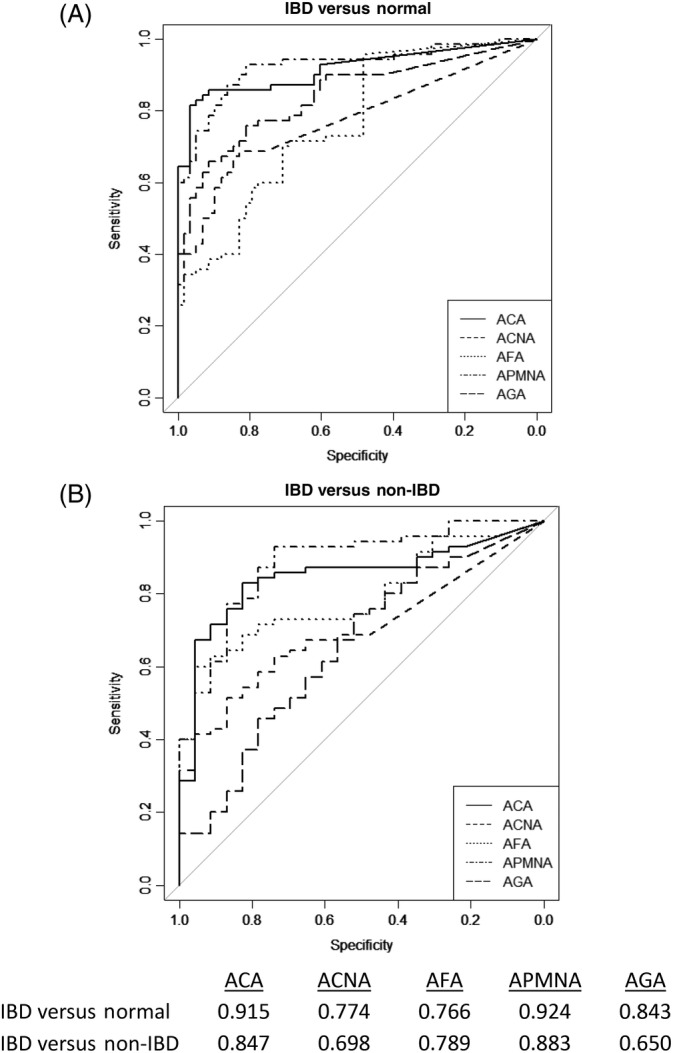
FIGURE 2.

Receiver operator characteristics curves for discriminating the IBD, Normal and non‐IBD cohorts for continuous serological markers and autoantibodies. Area under the curve (AUC) represents the discriminating performance of each marker. All AUC values for each of the markers when tested versus identity were statistically significant (Mann‐Whitney U statistic, P < .001)
