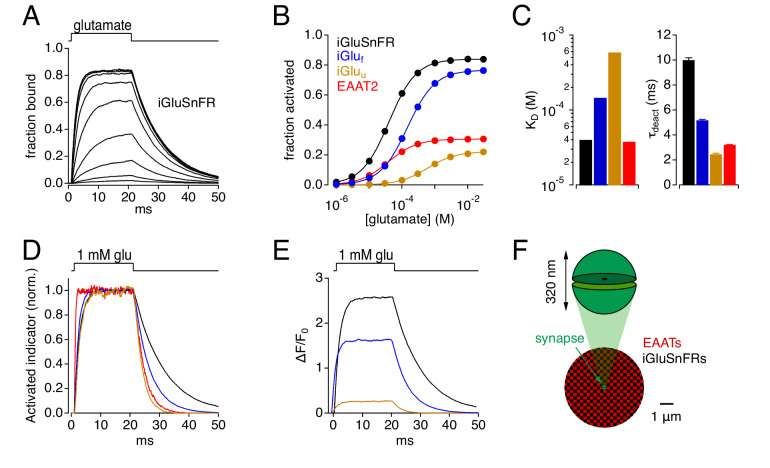
Figure 1. Simulations: Kinetic properties of glutamate indicators/transporters and simulated synaptic responses.
(A) Simulated iGluSnFR activation by 20 ms applications of glutamate (concentration steps varied logarithmically from 1 μM to 30 mM). (B) Comparison of simulated glutamate dose-response curves for iGluSnFR (black), iGluf (blue), iGluu (gold) and EAAT2 (red). Color scheme applies to the entire figure. (C) Simulated equilibrium affinities (KD, left) and deactivation time constants (mean ± SD, n = 10 different [glu] applications, right) for iGlus and EAAT2. (D) Activation of iGlus and EAAT2 by 1 mM glutamate, normalized and superimposed to compare activation and deactivation kinetics. (E) Responses of iGlus to 1 mM glutamate, scaled according to their background fluorescence and change in fluorescence upon activation (i.e., ΔF/F0 ≍ (Fon-Foff)/Foff; see Figure 1—figure supplement 1; Helassa et al., 2018). (F) Schematic diagrams of simulated synaptic structure (top) and surrounding extracellular space (bottom).


