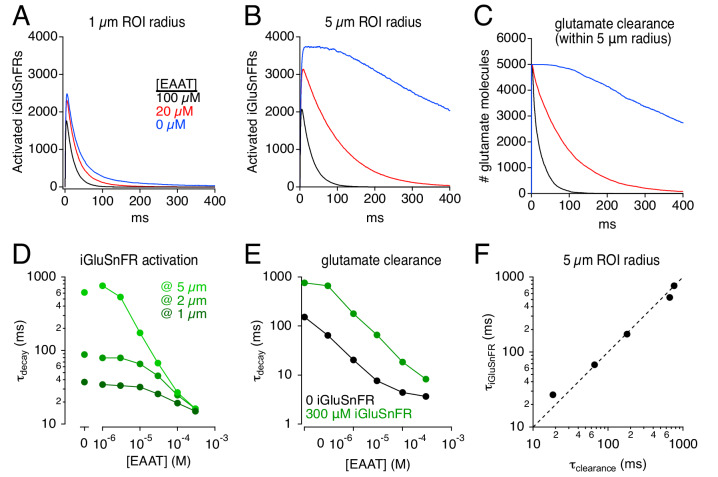
Figure 6. Simulations: iGluSnFR distorts effects of varying uptake capacity.
(A) iGluSnFR responses (300 μM iGluSnFR) simulated in three different EAAT concentrations. In the immediate vicinity of the synapse (1 μm ROI radius), reducing uptake capacity has little effect on iGluSnFR signal amplitude or time course. (B) As in A, but over a larger imaging volume (5 μm ROI radius), which exaggerates the effects of reducing uptake capacity. (C) Time course of glutamate clearance (uptake and diffusion beyond a 5 μm radius) in the conditions shown in A and B. (D) Summary graph showing the effects of EAAT concentration and ROI dimensions on the exponential decay time course of iGluSnFR activation. (E) The time course of glutamate clearance in the absence of indicator (black) and in the presence of 300 μm iGluSnFR (green). (F) The iGluSnFR signal measured across a 5-μm-radius ROI accurately reports the (modified) time course of glutamate clearance across a range of EAAT concentrations.

