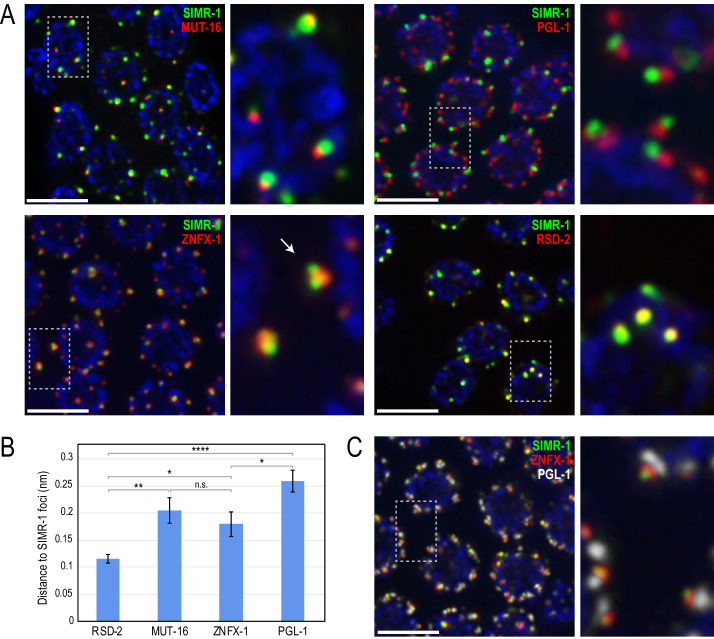
Figure 7. SIMR-1 localizes to foci adjacent to P granules and Mutator foci.
(A) Immunostaining of SIMR-1 (green) with MUT-16 (red, top left), PGL-1 (red, top right), ZNFX-1 (red, bottom left), and RSD-2 (red, bottom right) demonstrates that SIMR-1 localizes to foci near Mutator foci (MUT-16), P granules (PGL-1), and Z granules (ZNFX-1) but overlaps most substantially with RSD-2 foci. Arrow indicates an example of a single Z granule associated with two SIMR-1 foci. (B) Bar graph showing distance between the centers of fluorescence for indicated proteins to SIMR-1 (mean +/- SEM). See Materials and Methods for description of quantification methods. n.s. denotes not significant and indicates a p-value>0.05, * indicates a p-value≤0.05, ** indicates a p-value≤0.01, **** indicates a p-value≤0.0001. See Supplementary file 8 for more details regarding statistical analysis. (C) Immunostaining of SIMR-1 (green), ZNFX-1 (red), and PGL-1 (white) allows for visualization of the stacked SIMR/Z granule/P granule foci. All images are projections of 3D images following deconvolution. DAPI is blue in all panels and scale bars are 5 μm.


