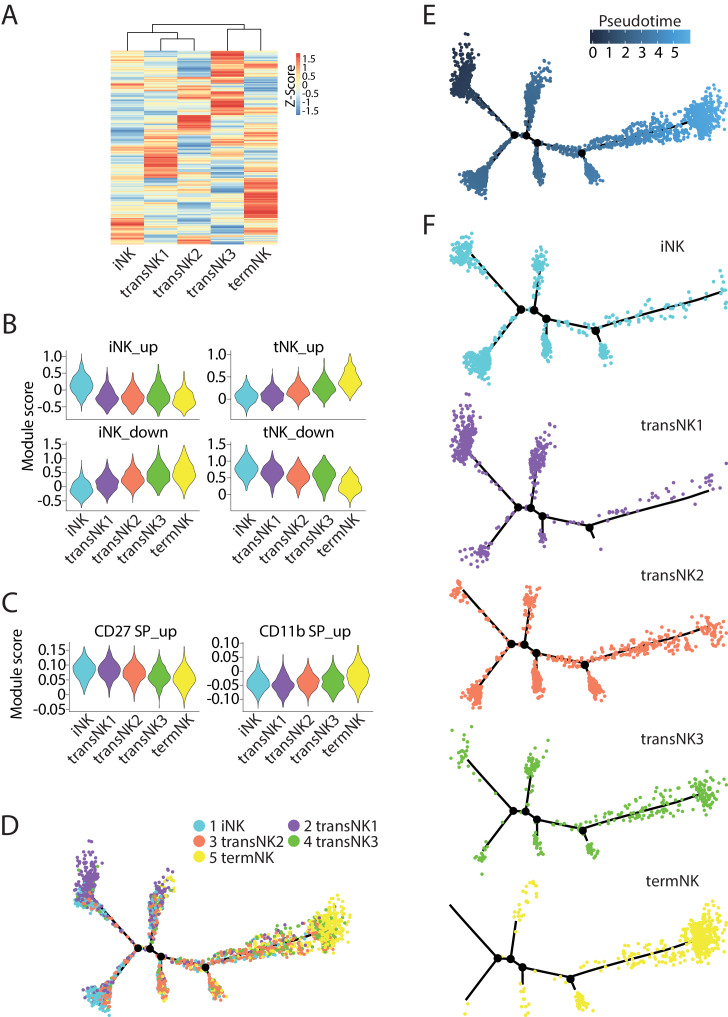
Figure 2. The relative maturity of the five distinct NK clusters.
(A) The transcriptome similarity among the five NK clusters was evaluated by the hierarchical clustering analysis and visualized via heatmap. Each row represents one of the highly variable genes across all cells and each column represents the average expression of these genes within one cluster. (B) Module scores were calculated using up-regulated or down-regulated DEGs of iNK and termNK clusters and plotted via violin plots. (C) The up-regulated genes in the CD27 SP and CD11b SP subset were extracted from the CD27/CD11b bulk RNA-seq dataset. The expression level of these genes in the five NK clusters were evaluated via calculating module scores and plotted via violin plots. (D) Distribution of all five NK clusters along the pseudotime trajectory. (E) The relative maturity of the developmental trajectory displayed across pseudotime. (F) Distribution of each NK clusters along the pseudotime trajectory.

