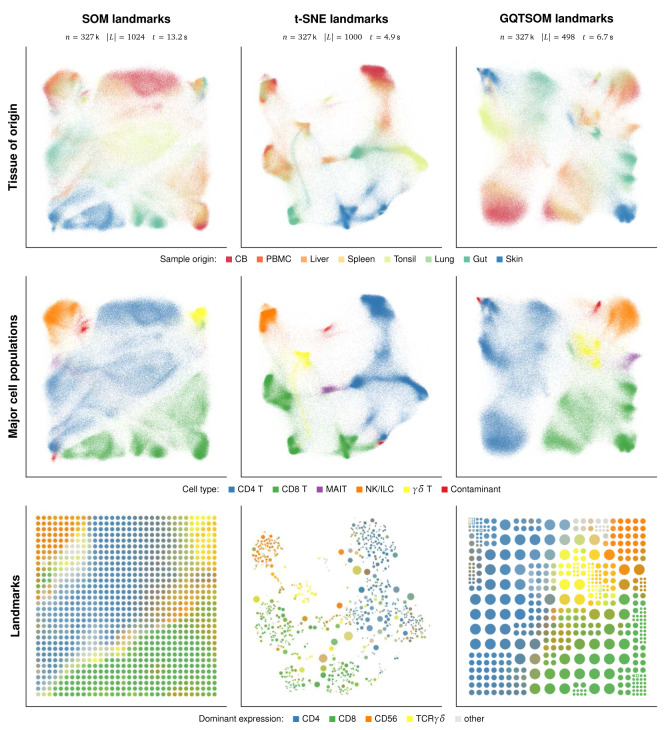
Figure 3. Comparison of EmbedSOM visualizations of the Wong dataset using different landmarks.
Top row: cells embedded using 3 different landmark-generating methods, colored by the tissue of sample origin. Middle row: The same embedding colored by major cell types. The colors used for annotation are purposefully reproduced from the article of Becht et al. 6 to simplify comparison. Bottom row: visualizations of the low-dimensional landmark images, colored by their corresponding marker expressions.

