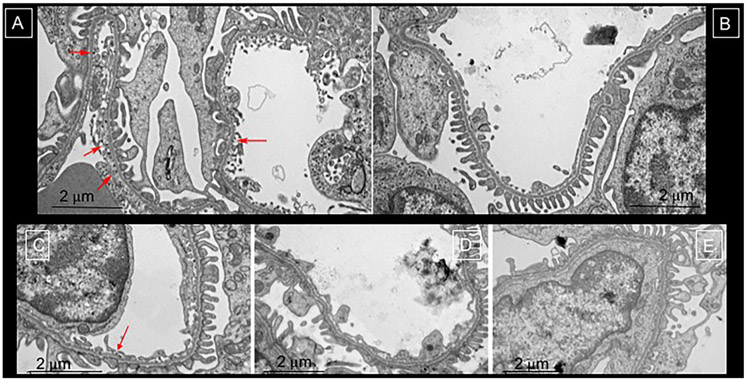
Figure 4. Transmission Electron Microscopy to validate cationic ferritin distribution in healthy (A), saline-injected controls (B) and those with AKI (C-E).
In panel A, the red arrows highlight the cationic ferritin traversing the endothelium and in the glomerular basement membrane. Whereas, there is no such labelling in panel B where the rabbit was injected with saline. In the rabbits exposed to AKI (C-E) the glomeruli in the damaged circumferential layer had heterogeneous and reduced labeling of CF in the glomerular basement membrane in C (red arrow indications CF deposition) and no CF in panels D and E. There was often podocyte effacement in these areas of reduced or lack of CF deposition.

