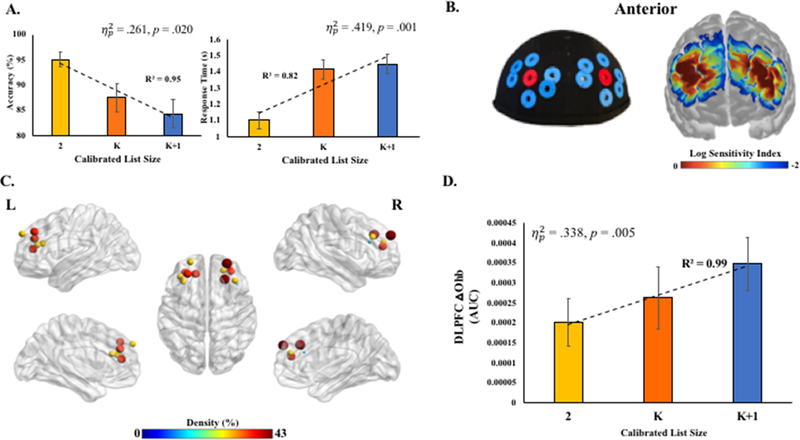
Figure 2.
A. Accuracy and response time as a function of calibrated list size on the fNIRS WM task. B. fNIRS probe configuration on cap and sensitivity index via Monte Carlo simulations of photon migration. Log sensitivity index values closer to zero reflect greater sensitivity for acquiring signals in that region (see Aasted et al., 2015). Two short- (7.5 mm from source [red grommets]) and 12 standard-separation (30 mm from source [blue grommets]) channels were placed in standardized space, and centered around left and right dorsolateral PFCs (F4 and F3 in 10–20 system) using AtlasViewer software (Aasted et al., 2015), MNI-space coordinates may be found in Supplemental Table 1. Localization of dorsolateral PFC on individual participants was achieved by land marking inion and nasion, and then securing the cap which was standardized to 10–20 landmarks surrounding bilateral dorsolateral PFCs. C. Post-filtering channel density. Size and color of nodes reflect the percent of participants retained after filtering for a given channel. D. Proof-of-principle hypothesis test (Supplemental; pre-registered at osf.io/hzvp9/). DLPFC aggregate oxyhemoglobin concentrations (area-under-the-curve [AUC]) from post-filtering channels increased with calibrated list size. Group mean and one standard error of the mean.

