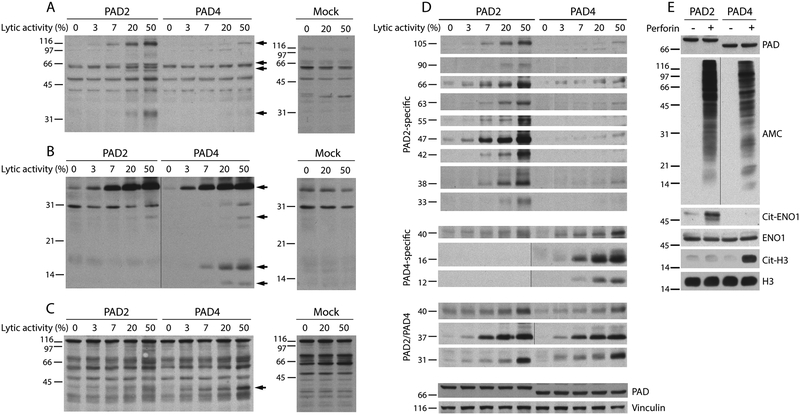
Figure 3.
PAD2 and PAD4 generate distinct patterns of citrullinated autoantigens. 293T cells expressing PAD2, PAD4 or mock transfected cells were incubated with increasing amounts perforin (the lytic activity is indicated). After 3 hrs at 37°C, the samples were electrophoresed and immunoblotted using human RA sera. (A-C) The filled arrows mark antigens generated during cellular hypercitrullination by PAD2 and/or PAD4. The data shown are from three representative RA sera out of the 12 individual RA sera tested. (D) Antigens generated by PAD2 or PAD4 during perforin-induced hypercitrullination in panels A-C and in supplementary Figure 1 were arranged according to their molecular weight and PAD specificity. The data summarize patterns of antigen recognition by nine individual RA sera. Detection of PADs and vinculin was used as loading controls. (E) 293T cells expressing PAD2 or PAD4 were incubated in the presence (+) or absence (–) of lytic amounts of perforin (50% lysis). After 3 hrs at 37°C, native and citrullinated histone H3 (H3 and cit-H3, respectively) were detected by immunoblotting and α-enolase (ENO1) was purified by immunoprecipitation (IP). The purified immune complexes were divided in two and analyzed by immunoblotting. Anti-ENO1 antibodies (also used for IP) and mouse anti-rabbit IgG light chain were used to detect ENO1. Citrullinated ENO1 (Cit-ENO1) was detected by AMC. PAD expression and global citrullination were visualized by immunoblotting using anti-PAD2, anti-PAD4 and AMC antibodies. The black vertical line marks panels in which intervening lanes containing irrelevant data was spliced out.

