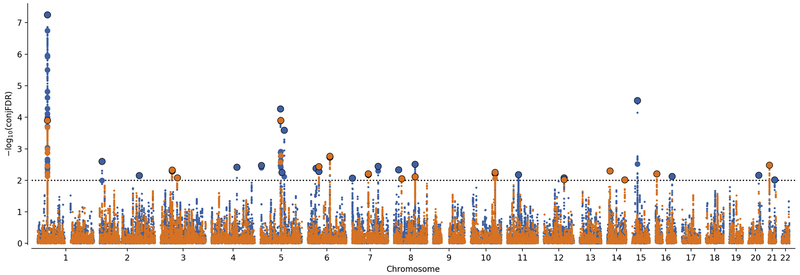
Figure 3.
Conjunctional False Discovery Rate (conjFDR) Manhattan Plot of Conjunctional –log10(FDR) Values. ADHD and Educational Attainment (EDU) (ADHD & EDU) is shown in blue, and ADHD and General Cognitive Ability (ADHD & INT) is shown in orange. Linkage disequilibrium (LD) independent single nucleotide polymorphisms (SNPs) with conjunctional –log10(FDR) higher than 2.0 (horizontal dotted line) (ie, conjFDR < 0.01) are shown with large points. A black line around the large points indicates the most significant SNP in a locus.

