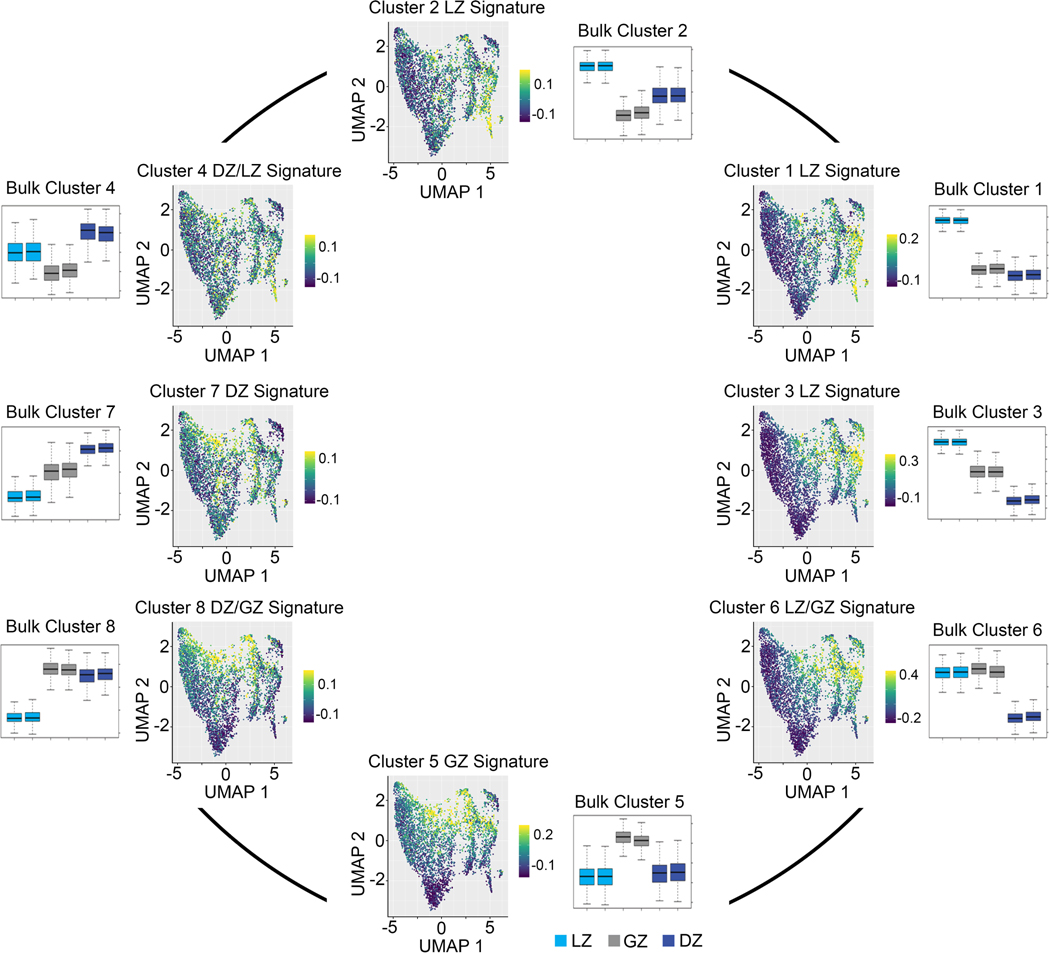
Extended Data Fig. 5. Analysis of single GCBC transcription in support of Figure 6.
scRNA-Seq UMAP plots generated with Monocle3 displaying the enrichment for gene expression signatures derived from bulk RNA-Seq clusters 1–8. Bulk RNA-Seq gene expression trend is displayed to the side of each scRNA-Seq UMAP plot. Boxes represent interquartile ranges (IQRs; Q1–Q3 percentile) and black vertical lines represent median values. Maximum and minimum values (ends of whiskers) are defined as Q3 + 1.5× the IQR and Q1 − 1.5× the IQR, respectively.

