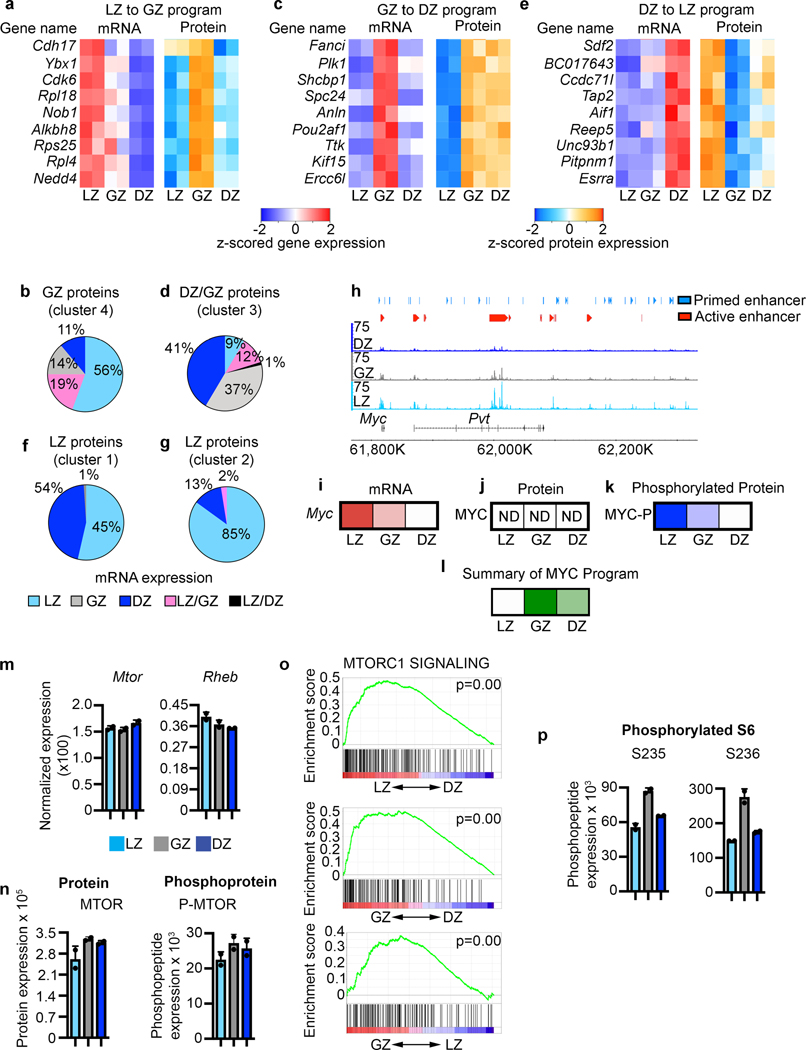
Figure 7. Molecular regulation of GCBC progression.
a, Heatmap of gene expression (left) and protein expression (right) for the indicated genes representing LZ to GZ program. b, Pie chart displaying the cell types with highest corresponding mRNA expression for the proteins that make up GZ protein cluster 4. c, Heatmap of gene expression (left) and protein expression (right) for the indicated genes representing the GZ to DZ program. d, Pie chart displaying the cell types with highest corresponding mRNA expression for the proteins that make up DZ/GZ protein cluster 3. e, Heatmap of gene expression (left) and protein expression (right) for the indicated genes representing the DZ to LZ program. f and g, Pie charts displaying the cell types with the highest corresponding mRNA expression for the proteins that make up LZ protein cluster 1 (f) and cluster 2 (g). h, Genome accessibility and enhancer tracks aligned at the Myc locus and downstream regulatory region. i, Relative Myc mRNA expression. j, Relative MYC protein expression. k, Relative phosphorylated-MYC levels. l, Relative activation or the downstream MYC program as determined by IPA upstream regulator analysis. In i-l, increased color intensity equals increased expression. m, mRNA expression for the indicated genes. n, Protein and phosphoprotein levels for the indicated proteins. o, Gene Set Enrichment (GSEA) for MTORC1 SIGNALING for the indicated comparisons. P values determined using GSEA program which implements Signal2Noise test coupled to Benjamini-Hochberg p-value correction algorithm (n=2 per cell type). p, Phosphoprotein levels for the indicated proteins. For m,n each dot corresponds to an independent biological sample. See also Extended Data Fig. 6.

