
Figure 3.
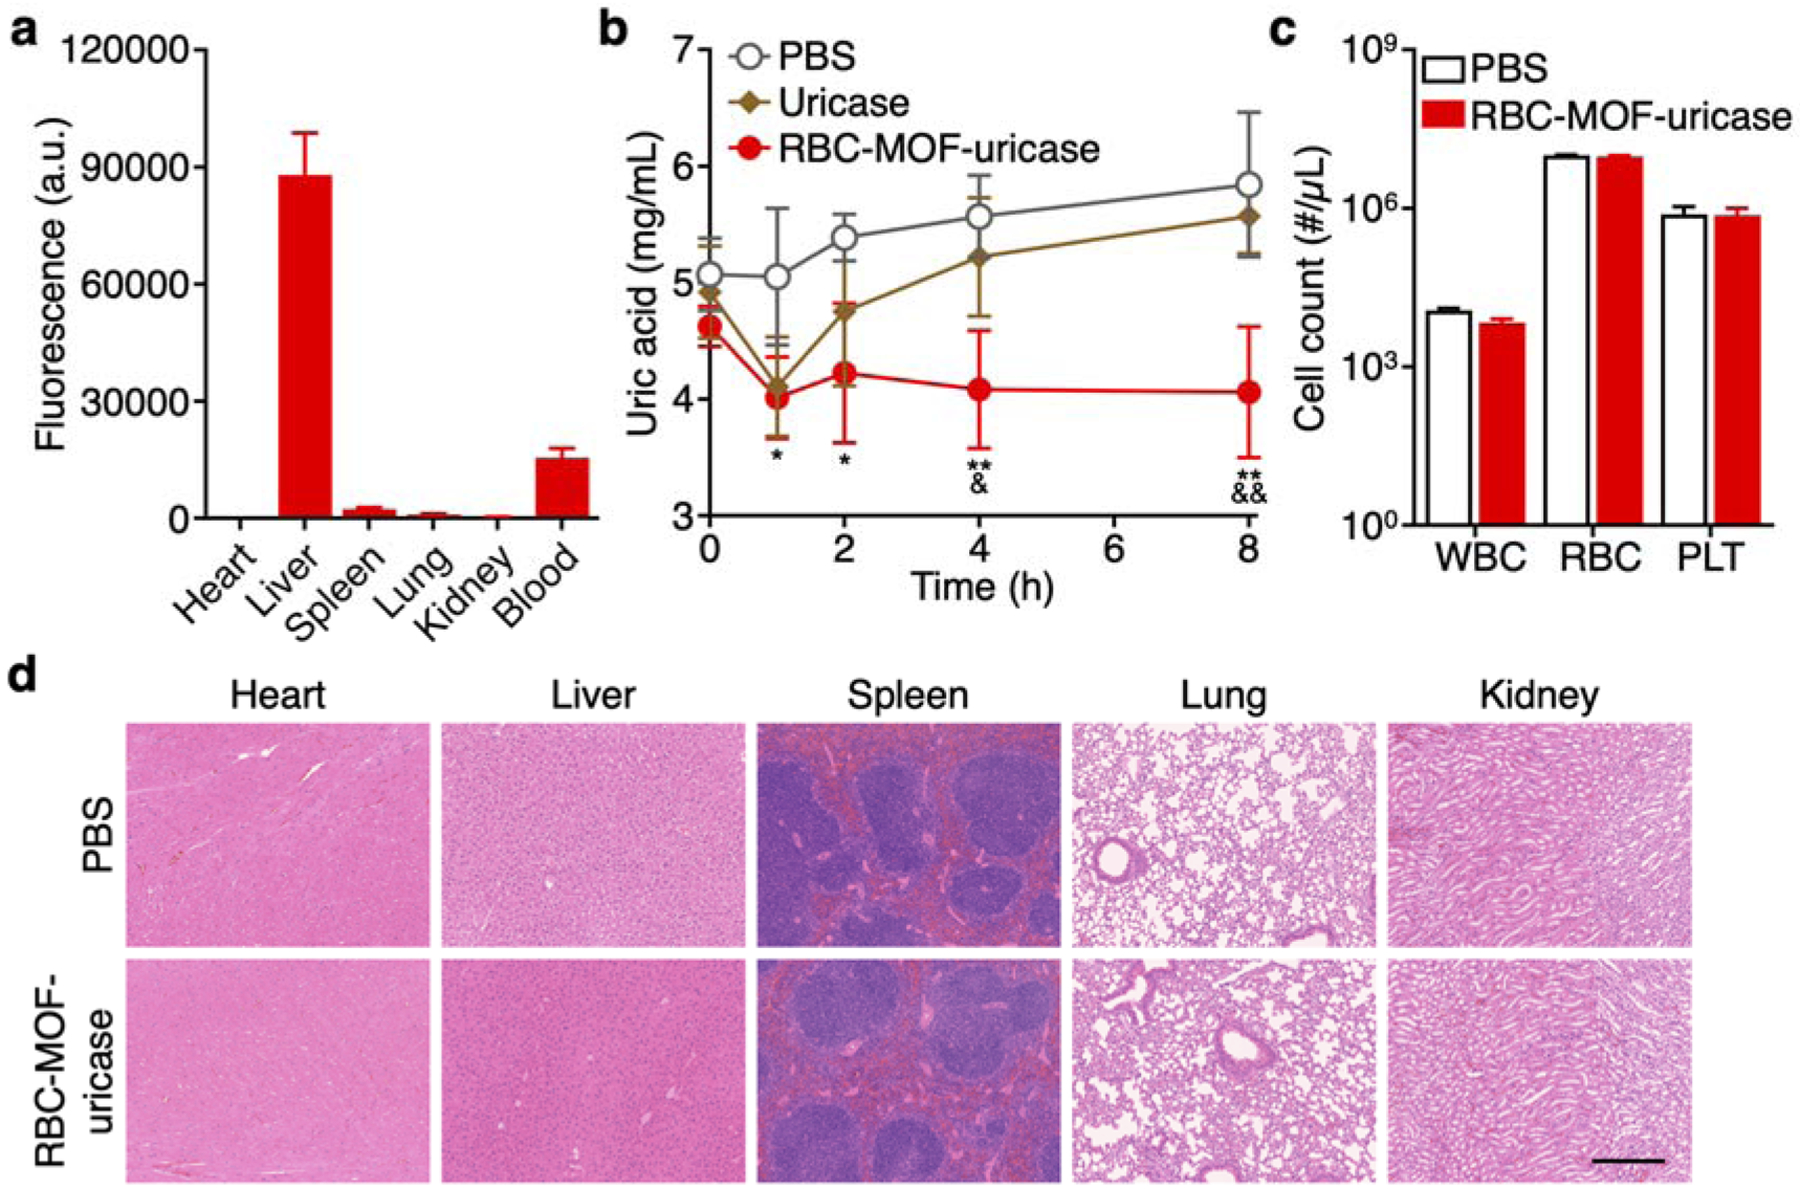
In vivo hyperuricemia management and safety. (a) Biodistribution of dye-labeled RBC-MOF-uricase in major organs, including the heart, liver, spleen, lungs, kidneys, and blood, 24 h after intravenous administration (n = 3, mean + SD). (b) Serum uric acid levels over time of hyperuricemic mice after intravenous treatment with PBS, free uricase, or RBC-MOF-uricase (n = 4, mean ± SD). *p < 0.05, **p < 0.01 (PBS compared with RBC-MOF-uricase); &p < 0.05, &&p < 0.01 (free uricase compared with RBC-MOF-uricase); one-way ANOVA. (c) Counts of various blood cells 24 h after intravenous administration of PBS or RBC-MOF-uricase (n = 3, geometric mean + SD). WBC: white blood cells, RBC: red blood cells, PLT: platelets. (d) H&E-stained histological sections from major organs 24 h after intravenous administration of PBS or RBC-MOF-uricase into healthy mice. Scale bar: 250 μm.