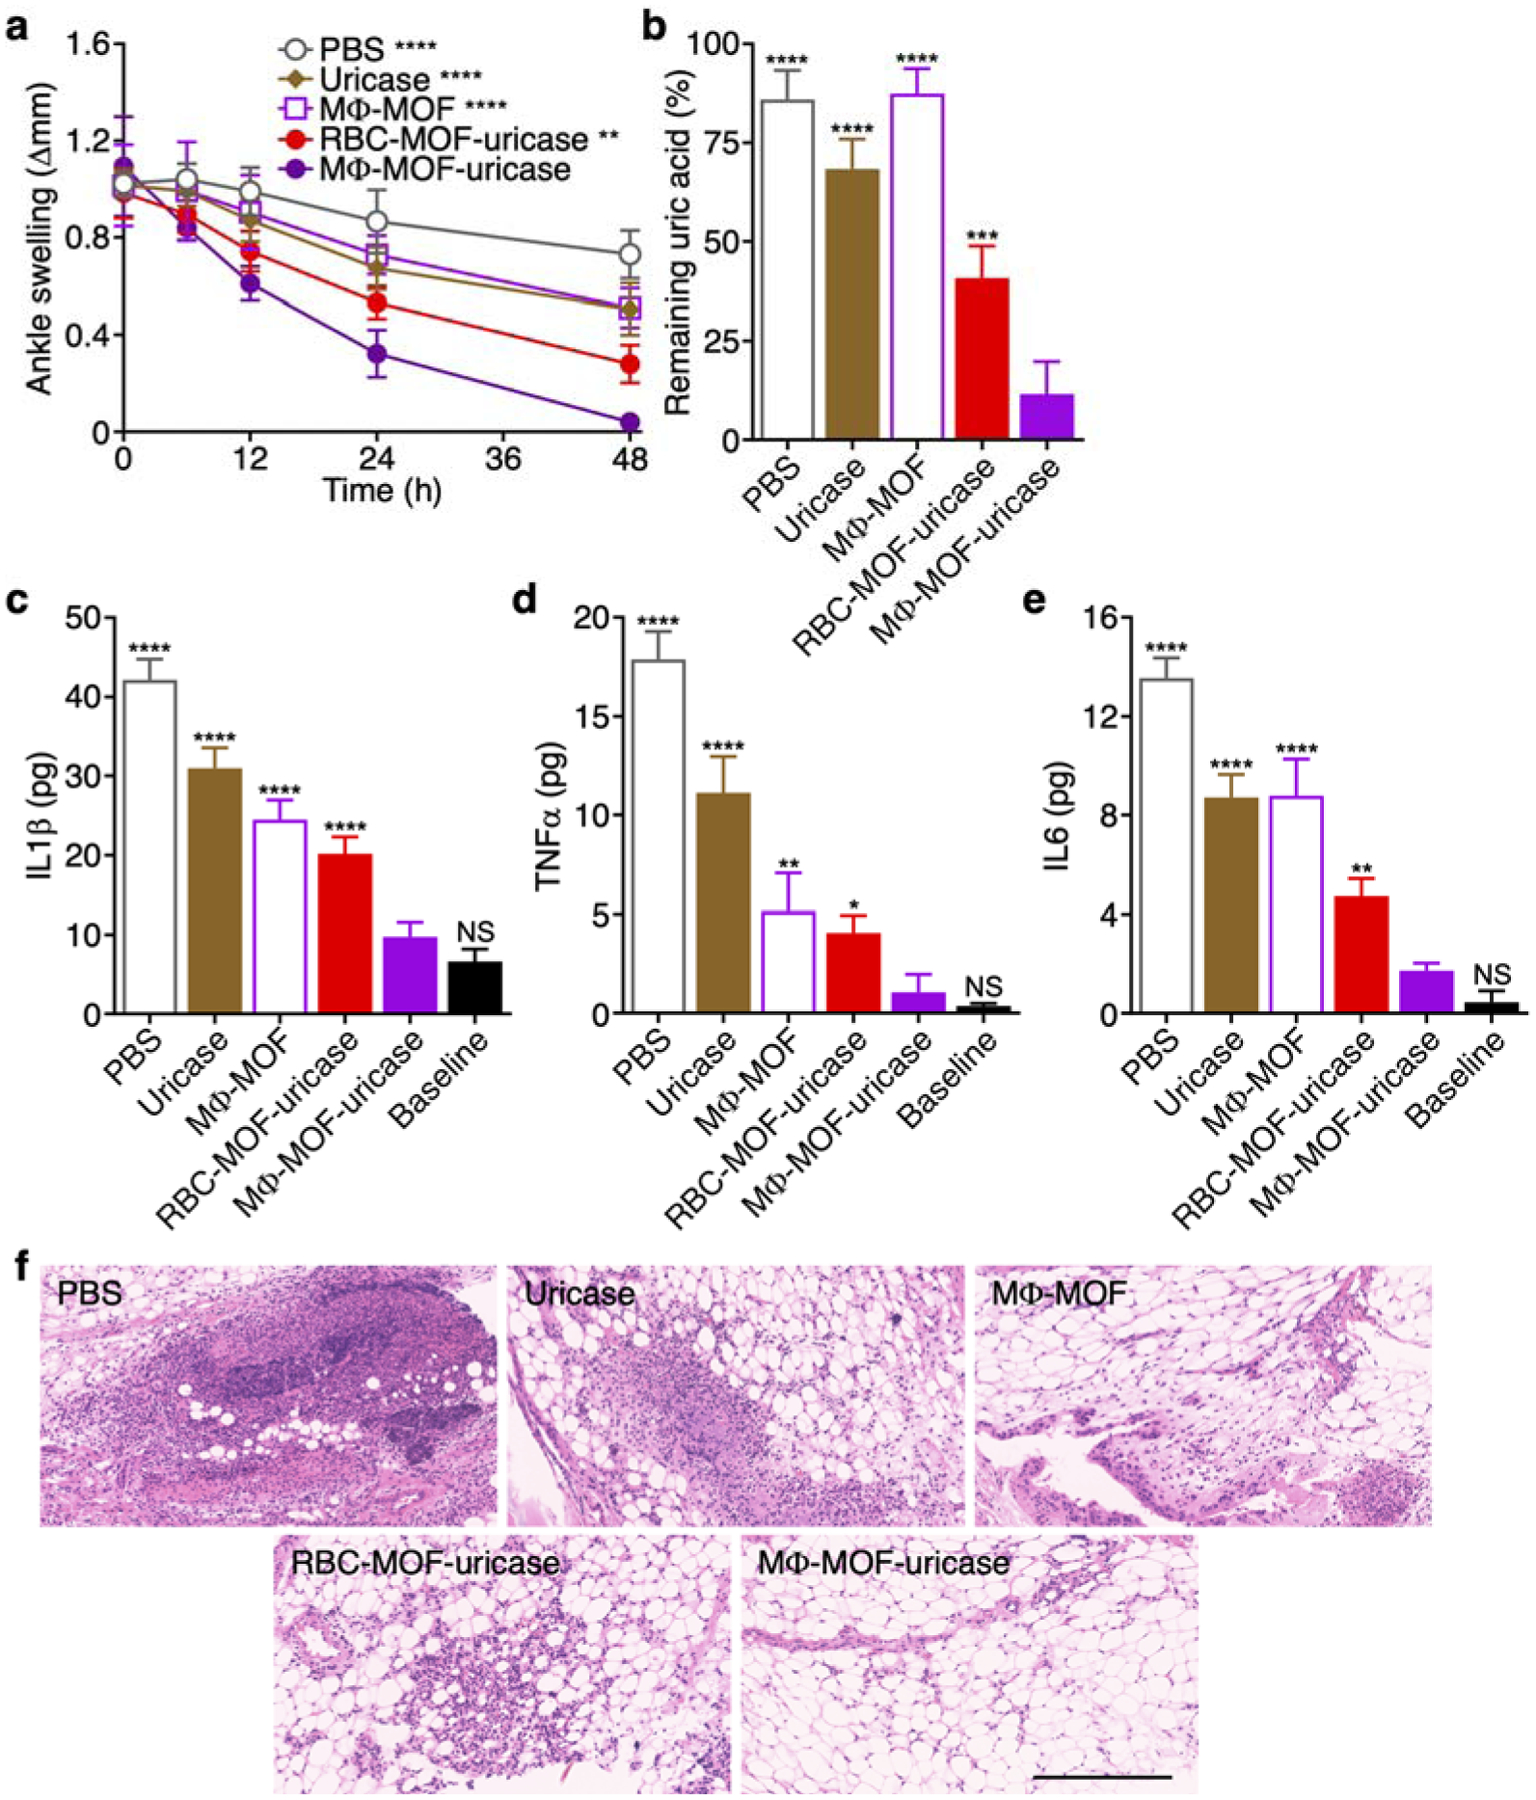
Figure 5.

In vivo gout management and safety. (a) Change in ankle joint diameter of mice with gout after intraarticular treatment with PBS, free uricase, MΦ-MOF, RBC-MOF-uricase, or MΦ-MOF-uricase (n = 4, mean ± SD). **p < 0.01, ****p < 0.0001 (compared with MΦ-MOF-uricase at 48 h); one-way ANOVA. (b) Remaining uric acid in the ankle joints of the mice in (a) after 48 h (n = 4, mean + SD). ***p < 0.001, ****p < 0.0001 (compared with MΦ-MOF-uricase); one-way ANOVA. (c-e) Levels of cytokines, including IL1β (c), TNFα (d), and IL6 (e), in the ankle joints of the mice in (a) after 48 h (n = 4, mean + SD). NS: not significant, *p < 0.05, **p < 0.01, ****p < 0.0001 (compared with MΦ-MOF-uricase); one-way ANOVA. (f) H&E-stained histological sections of ankle joints of the mice in (a) after 48 h. Scale bar: 250 μm.
